In the fast-moving world of crypto trading, where volatility can flip market sentiment in seconds, traders crave signals that are both simple and powerful. The hammer candlestick pattern delivers exactly that: a visually striking formation that tells a clear story of buyer rejection at lower prices. With its small body and long lower wick, the hammer is easy to spot and instantly recognizable, making it one of the most trusted reversal patterns for traders who want clarity amid chaos.
What makes the hammer so appealing is its ability to cut through noise: it shows when sellers tried to push the market down, but buyers fought back, often marking the start of a trend shift. In this blog, you will learn how to identify the hammer on charts, understand its variations, validate it with confirmation tools, and trade it effectively in crypto’s unique environment. Whether you are a beginner seeking straightforward signals or an experienced trader refining your strategy, mastering the hammer candlestick can add a reliable edge to your toolkit.
What Is the Hammer Candlestick Pattern?
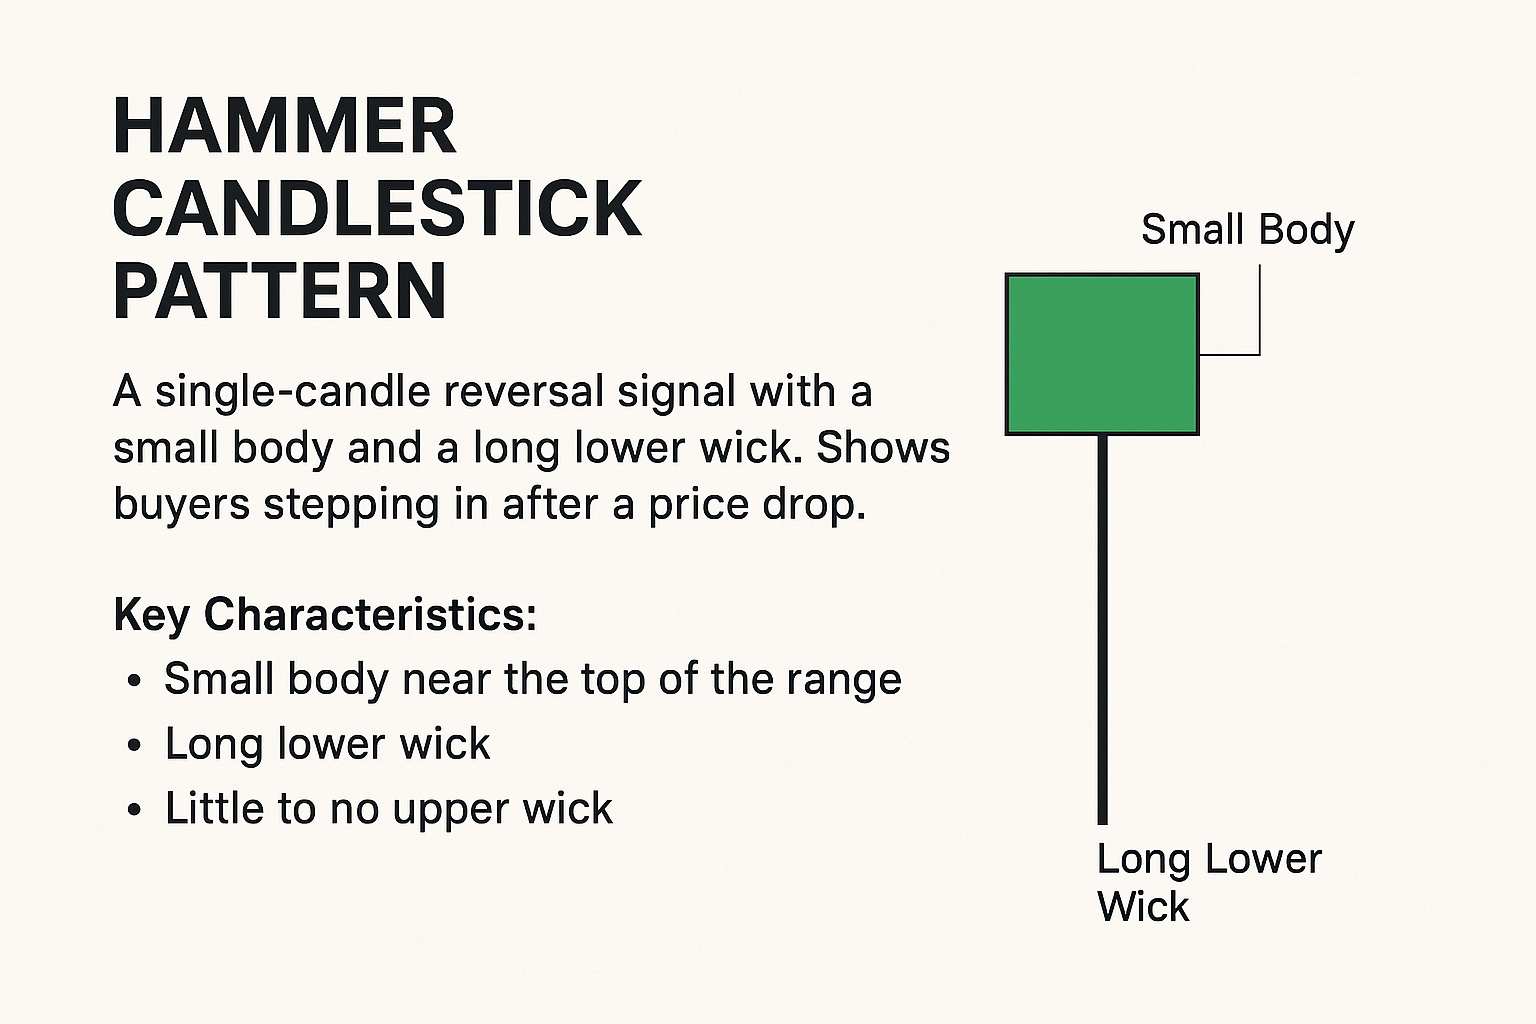
The hammer candlestick pattern is a bullish reversal signal that appears after a price decline. It has a small body near the top of the candle and a long lower wick, showing that sellers pushed the price down but buyers stepped in strongly to push it back up before closing. Its key characteristics include;
- Single-candle formation: Appears after a downtrend, signaling potential reversal.
- Small body near the top: Indicates closing price is close to the opening price.
- Long lower wick (at least 2x the body size): Shows strong rejection of lower prices.
- Little to no upper wick: Reinforces that buyers regained control.
- Psychology: Sellers drove the price down, but buyers absorbed the pressure and reversed momentum.
The hammer candlestick pattern matters because it signals a potential bullish reversal after a downtrend, giving traders an early indication that selling pressure may be weakening and buyers are stepping in. Its distinctive shape, a small body near the top with a long lower wick, reflects a failed attempt by sellers to push prices lower, followed by a strong recovery. This shift in momentum can help traders identify possible entry points for long positions, especially when confirmed by a subsequent bullish candle. While powerful, the hammer pattern is best used with other indicators or volume analysis to validate its reliability.
Why Volume Matters When Trading Hammer Candles
In crypto markets, volume is the key validator of a hammer candlestick’s strength. A hammer with higher-than-average volume signals genuine buyer interest and a potential trend reversal, while low volume suggests weak conviction and increases the risk of a false bounce or continued downtrend.
- Volume Confirms Market Participation: A hammer candle shows buyers stepping in after a sell-off. But without strong volume, it’s unclear whether the buying pressure is meaningful or just a temporary pause. High volume = real demand. It means many participants are actively buying at the lows.
- High Volume Signals Reversal Strength: When a hammer forms on above-average volume, it suggests that buyers overwhelmed sellers and absorbed the sell pressure. This increases the likelihood of a bullish follow-through in the next candles. Traders often use volume spikes as confirmation before entering long positions.
- Low Volume = Caution: A hammer on low or average volume may be a weak bounce or short-covering, not a true reversal. It is more likely to fail, especially in volatile crypto markets where fakeouts are common. There is a risk of a trap, as the price may briefly rise before resuming the downtrend.
| Feature | High Volume Hammer | Low Volume Hammer |
| Buyer conviction | Strong | Weak or uncertain |
| Reversal reliability | Higher | Lower |
| Follow-through potential | More likely | Less Likely |
| Risk of false signal | Reduced | Elevated |
| Ideal for entry? | Yes, with confirmation | Wait for more signals |
Always check volume relative to recent candles. If the hammer forms with a volume spike that is above the 20-day average, it is a stronger signal. Combine this with RSI or support zones for added confidence.
How the Hammer Candlestick Pattern Works
The hammer candlestick pattern works because it captures a shift in market psychology during a downtrend. At the start of the candle, bears push the price lower, continuing the selling pressure that has dominated the trend.
This creates a long lower wick, indicating sellers were in control for much of the session. However, by the close, bulls step in aggressively, buying up the asset and driving the price back near its opening level. The result is a small body at the top of the candle with a long tail beneath it.
This dynamic is considered a bullish sign in a downtrend because it shows that buyers were strong enough to absorb selling pressure and reverse momentum within the same session. In other words, the hammer signals that the market may have reached a level where sellers are exhausted and buyers are willing to defend the price.
Traders interpret this as a potential reversal point, especially when the hammer appears at a support zone or is confirmed by higher volume and a bullish candle afterward.
Hammer Candlestick Pattern Chart Examples
Hammer candlestick patterns are best understood when seen in real market charts. In crypto trading, their reliability depends not only on the candle’s structure but also on trend context, wick length, and volume behavior. Let’s break down examples of valid and invalid hammers, and then compare how they play out in Bitcoin versus altcoins.
Valid Hammer Pattern Example
A textbook hammer forms after a clear downtrend, often near a support level.
- Structure: Small body near the top of the range, long lower wick (at least 2x the body size), little to no upper wick.
- Context: Appears at a key support zone after multiple red candles.
- Volume: Stronger-than-average volume confirms real buyer interest.
- Confirmation: The next candle closes higher, validating the reversal.
Example: Bitcoin drops steadily, prints a hammer at $30,000 support with a long wick down to $29,200, then the next day closes bullish above $30,500.
Weak or Invalid Hammer Example
Not every hammer-shaped candle is reliable. Common failed setups include:
- No downtrend: A hammer in the middle of an uptrend is meaningless.
- Small wick: If the lower wick isn’t at least twice the body, it lacks reversal strength.
- Heavy upper wick: Suggests sellers still have control.
- Low volume: Weak participation increases the risk of a false signal.
- Immediate breakdown: If the next candle closes lower, the hammer fails.
Example: An altcoin prints a hammer-like candle after a sideways chop, with a short wick and low volume. Price breaks down further in the next session.
Bitcoin vs Altcoin Hammers
Hammer reliability differs significantly between major coins (BTC/ETH) and volatile altcoins:
| Factor | BTC/ETH Hammers | Altcoin Hammers |
| Liquidity | Deep liquidity reduces manipulation | Thin liquidity makes fakeouts common |
| Wick Behavior | Cleaner, more reliable wick structures | Erratic wicks due to low order book depth |
| Volume Signals | High-volume hammers often confirm reversals | Volume spikes may be artificial (pump/dump) |
| Reliability | Higher probability of reversal | Lower probability. Requires extra confirmation |
Hammer Candlestick Pattern Pros and Cons for Crypto Traders
The hammer candlestick pattern is a popular tool among crypto traders because of its simplicity and clear visual signal. However, like all technical indicators, it has both strengths and limitations, especially in volatile and low-liquidity markets.
Pros
- Simplicity: Easy to spot on charts, even for beginners, thanks to its distinct shape (small body, long lower wick).
- Clear invalidation levels: Traders can set stop-loss orders just below the hammer’s wick, making risk management straightforward.
- Effectiveness near support zones: Works best when it appears after a downtrend at a key support level, signaling potential reversal.
- Psychological insight: Reflects a shift in market sentiment. Sellers lose control as buyers step in to defend price.
- Versatility: Can be applied across different timeframes, from intraday trading to long-term analysis.
Cons
- False signals: In crypto’s volatile environment, hammers can appear frequently but fail to deliver true reversals.
- Wick manipulation: Thin liquidity in altcoins often leads to exaggerated wicks caused by large players or bots, creating misleading hammer patterns.
- Need for confirmation: A hammer alone isn’t enough; traders should wait for a bullish follow-up candle or volume spike to validate the signal.
- Context dependency: Without a preceding downtrend, a hammer loses its meaning and may mislead traders.
- Risk of over-reliance: Using hammers in isolation ignores broader market conditions, leading to poor trade decisions.
Types of Hammer Candlestick Patterns
The hammer “family” of candlestick patterns all share a similar structure, small body with a prominent wick, but their meaning changes depending on market context (downtrend vs. uptrend) and shape orientation. In crypto trading, these subtle differences can signal either bullish reversals or bearish exhaustion.
Classic Hammer (Bullish Hammer)
- Appearance: Small body near the top, long lower wick (at least 2x the body size), little or no upper wick.
- Context: Forms after a downtrend, often at support.
- Psychology: Bears push price down, but bulls recover it by the close, rejecting lower levels.
- Meaning: Signals potential bullish reversal as buyers step in with conviction.
Inverted Hammer
- Appearance: Small body near the bottom, long upper wick, little or no lower wick.
- Context: Appears after a downtrend.
- Psychology: Bulls attempt to push the price higher during the session, but sellers drag it back down before close.
- Why Confirmation Matters: Without a bullish follow-up candle, the inverted hammer can fail, as sellers may still dominate.
Hanging Man (Bearish Hammer Variant)
- Appearance: Same shape as a classic hammer (small body, long lower wick).
- Context: Forms after an uptrend, near resistance.
- Psychology: Sellers show strength by driving price down intraday, even though bulls recover by the close.
- Meaning: Bearish warning. It suggests potential trend exhaustion and a downward reversal.
Shooting Star (Bearish Inverted Hammer Variant)
- Appearance: Small body near the bottom, long upper wick.
- Context: Appears after an uptrend, often at market highs.
- Psychology: Bulls push price higher, but sellers overwhelm them, forcing a close near the open.
- Meaning: Signals a possible bearish reversal, showing buyers are losing control at elevated levels.
Dragonfly Doji (Hammer-Like Pattern)
- Appearance: Doji body (open and close nearly equal) with a very long lower wick and no upper wick.
- Context: Forms after a downtrend.
- Psychology: Sellers drive price sharply lower, but buyers completely recover it by the close, leaving a flat body.
- Meaning: Strong bullish reversal signal, especially when confirmed by volume, as it shows extreme rejection of lower prices.
Hammer vs Hanging Man: How Are They Different
The hammer and hanging man candlestick patterns have identical shapes, a small body near the top and a long lower wick, but their meanings diverge entirely based on trend context.
| Feature | Hammer (Bullish) | Hanging Man (Bearish) |
| Trend Context | After a downtrend | After an uptrend |
| Candle Shape | Identical: small body, long lower wick | Identical: small body, long lower wick |
| Market Psychology | Buyers reject lower prices | Sellers show signs of control |
| Signal Type | Bullish reversal | Bearish reversal |
| Confirmation Needed | Bullish follow-up candle | Bearish follow-up candle |
The shape alone doesn’t define the signal; the trend context is everything. A hammer at the bottom of a chart can be a buy signal, while the same candle at the top might be a warning to sell.
How to Trade the Hammer Candlestick Pattern: Step-by-Step
To trade the hammer candlestick pattern effectively in crypto, follow a structured 8-step framework that emphasizes trend context, volume confirmation, and disciplined risk management. This approach helps filter out false signals and improves trade reliability in volatile markets.
Step 1: Confirm You’re in a Downtrend First
Before trusting any hammer signal, traders must first confirm that the market is in a downtrend or experiencing a meaningful pullback. This context is essential because the hammer is a bullish reversal pattern; it only makes sense when it appears after sustained selling pressure. Look for a series of lower highs and lower lows, or use moving averages and trendlines to validate bearish momentum. Avoid trading hammers in sideways or bullish markets, where they lose their predictive power.
Step 2: Validate the Candle’s Shape + Location
Not all hammer-shaped candles are valid. A proper hammer should have a small body near the top of the candle range and a long lower wick that’s at least twice the size of the body. There should be little to no upper wick. Just as important as the shape is the location: the hammer must appear near a support level, demand zone, or psychological price floor. A hammer floating mid-range or in random consolidation is far less reliable.
Step 3: Check Volume
Volume is a key filter for hammer setups. A hammer that forms on above-average volume suggests real buyer interest and increases the likelihood of a true reversal. Low volume, on the other hand, may indicate weak participation or a temporary bounce that’s likely to fail. Compare the hammer’s volume to the average of the last 20 candles to assess whether it stands out meaningfully.
Step 4: Wait for Confirmation
To avoid false signals, traders should wait for confirmation before entering a trade based on a hammer. Confirmation typically comes in the form of a bullish candle that closes above the high of the hammer. This follow-through shows that buyers are truly in control and validates the reversal. Without confirmation, the hammer could simply be a pause before further downside.
Step 5: Choose Your Entry Strategy
There are two main entry strategies for hammer trades: aggressive and conservative. Aggressive traders enter at the close of the hammer candle, aiming for a better price but accepting higher risk. Conservative traders wait for the confirmation candle to close above the hammer’s high before entering, reducing the chance of a fakeout but potentially missing fast moves. The choice depends on your risk tolerance and trading style.
Step 6: Set a Smart Stop Loss
Risk management is critical in crypto’s volatile environment. A smart stop loss should be placed just below the hammer’s wick, giving the trade room to breathe while protecting against deeper breakdowns. Consider using the Average True Range (ATR) to add a volatility buffer, or apply a fixed percentage below the wick. Avoid placing stops too tightly, as this can lead to premature exits.
Step 7: Set Take Profit Targets
The take profit levels should be defined before entering the trade. Use nearby resistance zones, Fibonacci retracements, or R-multiples (e.g., 2R or 3R) to set realistic targets. Many traders scale out of positions, such as taking partial profits at 1R and trailing the rest, to lock in gains while staying open to further upside. Avoid overly ambitious targets in choppy or low-volume conditions.
Step 8: Manage the Trade After Entry
Once in the trade, active management is key. Adjust your stop-loss upward as price forms higher lows, and consider taking partial profits at predefined levels. If the market shows signs of weakness or reversal, be ready to exit. Trade management helps protect gains and reduce emotional decision-making, especially in fast-moving crypto markets.
Top Indicators to Combine With Hammer Candlesticks
To improve the accuracy of hammer candlestick signals in crypto trading, pair them with confirmation indicators such as RSI, volume, moving averages, and support/resistance zones. These tools help filter out false reversals and validate buyer strength in volatile markets.
- The Relative Strength Index (RSI) is a momentum tool that helps confirm hammer signals. When a hammer forms while RSI is below 30, it suggests the market is oversold, and buyers may be stepping in. Even stronger is when price makes a lower low but RSI makes a higher low, showing bearish momentum is weakening.
- Volume is one of the most important filters. A hammer with above-average trading volume indicates genuine buyer interest and reduces the chance of a false reversal. On the other hand, a hammer with low volume is often unreliable, especially in thinly traded altcoins where fakeouts are common.
- Moving Averages provide trend context and dynamic support or resistance. If a hammer appears near a key moving average like the 50 EMA or 200 EMA, it often marks a strong bounce zone. Traders use these levels as confluence points. When the price respects the moving average and prints a hammer, the setup gains credibility.
- Support and Resistance Zones are critical for hammer reliability. A hammer forming at a major support level, such as a previous swing low, Fibonacci retracement, or psychological round number, is far more likely to succeed. Mapping these zones helps traders identify where buyers historically stepped in.
- The MACD or Stochastic Oscillator can provide additional confirmation. If MACD is crossing bullish or the Stochastic oscillator is turning up from oversold, it strengthens the hammer’s reversal case. These indicators lag slightly, so they’re best used as supporting evidence rather than primary entry triggers.
Together, these tools give hammer candlesticks the context they need. The candle shows rejection of lower prices, but indicators like RSI, volume, and support zones confirm whether that rejection is strong enough to trust.
Risk Management When Trading Hammer Patterns
Hammer candlestick patterns can be powerful reversal signals, but in crypto’s volatile environment, they must be paired with disciplined risk management. Without it, even the best-looking hammer setups can lead to large drawdowns. Here’s how traders can protect themselves:
- Position Sizing: Proper position sizing prevents any single trade from wiping out your account. Traders should risk only a small percentage of their capital per trade, commonly 1–2% of total equity. This way, even if a hammer setup fails, the loss is manageable and doesn’t derail long-term performance.
- Stop-Loss Discipline: A hammer trade is invalidated if the price breaks below the candle’s wick. Placing a stop-loss just below the hammer low protects against deeper breakdowns. In crypto, where volatility is high, stops should allow for some “noise” but still cut losses quickly if the reversal fails. Using ATR (Average True Range) or volatility buffers helps avoid premature stop-outs.
- Leverage Control: Leverage magnifies both gains and losses. In crypto markets, excessive leverage is one of the fastest ways to blow up accounts. Traders should use low to moderate leverage (or none at all) when trading hammer setups, especially in altcoins with thin liquidity. Keeping leverage under control ensures that a failed hammer doesn’t turn into a catastrophic loss.
- Handling Volatility: Crypto markets are notorious for sudden spikes and whipsaws. To manage volatility, traders should avoid overly large positions, set realistic profit targets, and consider scaling out of trades. Monitoring market conditions, such as news events or liquidity shifts, helps prevent being caught in unpredictable swings.
Hammer candlesticks can highlight powerful turning points, but they are not foolproof. By combining position sizing, disciplined stop-losses, controlled leverage, and volatility awareness, traders can protect their capital and avoid large drawdowns. Risk management transforms hammer setups from risky guesses into structured, sustainable strategies.
Common Mistakes Traders Make With Hammer Patterns
Even though hammer candlesticks are one of the most recognizable reversal signals, many crypto traders fall into traps when trading them. These mistakes often stem from misinterpreting the candle’s context or failing to apply proper risk management.
- Ignoring Trend Context is one of the biggest errors. A hammer only has meaning when it appears after a downtrend. Traders who spot a hammer in the middle of an uptrend or sideways market often misread it, leading to false signals and poor entries.
- Skipping Confirmation is another frequent mistake. Entering a trade immediately after a hammer forms without waiting for a bullish follow-up candle increases the risk of being caught in a fake reversal. Confirmation helps validate that buyers truly have control.
- Overleveraging is especially dangerous in crypto markets. Traders who use excessive leverage on hammer setups risk large losses if the pattern fails. Even a small wick break can trigger liquidation when leverage is too high.
- Misreading Wicks can also cause problems. A proper hammer requires a long lower wick at least twice the body’s diameter. Traders sometimes mistake candles with short wicks or heavy upper shadows for hammers, diluting the signal and leading to unreliable trades.
- Trading Hammers in Choppy or Low-Volume Conditions is another common pitfall. In thinly traded altcoins or sideways markets, hammers often appear due to random volatility or manipulation rather than genuine buyer strength. Without volume confirmation, these setups are prone to failure.
Hammer candlesticks are powerful tools, but only when used correctly. Avoiding these mistakes, by respecting trend context, waiting for confirmation, managing leverage, reading wick structure properly, and filtering with volume, can dramatically improve trading outcomes.
Is the Hammer Candlestick Pattern Reliable in Crypto Markets?
The hammer candlestick is one of the most recognizable reversal signals, but in crypto markets, its reliability depends heavily on context, confirmation, and volume. Unlike traditional equities, crypto trading is more volatile and prone to manipulation, which means traders must be selective when acting on hammer setups.
When It Works Best
The hammer pattern is most reliable when it appears after a clear downtrend and near a major support zone. Its long lower wick shows that sellers tried to push prices lower, but buyers stepped in aggressively to defend the level. If this rejection is accompanied by above-average volume, it signals genuine demand and increases the likelihood of a bullish reversal.
Confirmation from the next candle closing higher further validates the setup. In liquid markets like Bitcoin or Ethereum, hammers at strong support levels often provide solid entry points.
When It Fails
Hammers frequently fail in choppy or sideways markets, where price action lacks clear direction. They are also unreliable in low-liquidity altcoins, where exaggerated wicks can be caused by a single large order or manipulation.
A hammer without volume support or that appears outside a downtrend is often a false signal. Additionally, if the next candle closes below the hammer’s low, the pattern is invalidated and can lead to further downside.
Why Confirmation, Volume, and Context Are Essential
- Confirmation: Waiting for a bullish candle after a hammer reduces the risk of a false reversal.
- Volume: Strong volume shows real buyer participation, while weak volume suggests the move may be temporary.
- Market Context: Trend direction and support/resistance zones determine whether the hammer is meaningful. A hammer at support after a downtrend is bullish; the same candle at resistance after an uptrend (hanging man) is bearish.
Final Thoughts
The hammer candlestick pattern is a powerful visual cue of market psychology, showing how buyers can step in to push prices higher after a downtrend. But its true value lies in context and confirmation, as a hammer alone is not enough to build a reliable trading strategy. Traders must ensure the pattern forms at meaningful support levels, validate it with volume, and wait for a bullish follow-up candle before acting.
In crypto’s volatile environment, disciplined execution is essential. Proper risk management, such as position sizing, stop-loss placement, and leverage control, helps protect against large drawdowns when setups fail. Backtesting hammer-based strategies across different coins and timeframes helps traders understand where the pattern works best and where it’s prone to false signals.
Ultimately, the hammer should be treated as a confirmation-based signal within a broader trading framework, not a standalone shortcut. When combined with technical indicators, market context, and strict risk control, it becomes a valuable tool for spotting potential reversals and building consistency in crypto trading.
Frequently Asked Questions
How effective hammer candlestick pattern in crypto markets?
The hammer candlestick pattern can be effective in crypto markets when it forms after a clear downtrend, near strong support, and with high volume confirmation. However, in volatile or low-liquidity coins, false signals are common. Reliability improves with disciplined risk management and confirmation from subsequent bullish candles.
Is the hammer candlestick bullish or bearish?
The hammer candlestick is generally bullish, signaling a potential reversal after a downtrend. Its long lower wick shows sellers pushed prices down, but buyers regained control before the close. However, confirmation from the next candle and strong volume are essential to validate its reliability in crypto markets.
What timeframe is best for trading hammer candles in crypto?
Hammer candlesticks work best on higher timeframes like 4-hour or daily charts, where signals are less noisy and more reliable. Shorter timeframes often produce false hammers due to volatility. Combining higher timeframe hammers with confirmation and volume improves accuracy and reduces the risk of misleading setups.
Can I trade hammer candlesticks on altcoins?
Yes, you can trade hammer candlesticks on altcoins, but reliability is lower due to thin liquidity and frequent wick manipulation. Always confirm with volume, trend context, and follow-up candles. Stronger signals appear on higher timeframes and at key support zones, reducing the frequency of false reversals in volatile altcoin markets.
How useful are hammer candlestick patterns for futures trading?
Hammer candlestick patterns can be useful in futures trading as reversal signals, especially after a downtrend at strong support levels. Their reliability improves with confirmation from subsequent bullish candles and high volume. However, due to leverage and volatility in futures, strict risk management is essential to avoid large losses.
Disclaimer
This article is for educational and information purposes, and should not be considered financial advice. For more information visit our disclaimer page
About the Author