Stepping into the world of crypto technical analysis can feel overwhelming. Charts filled with candlesticks, strange acronyms like RSI and MACD, and endless lines of support and resistance often look more like a puzzle than a roadmap. For many beginners, this complexity becomes a barrier, leading to frustration, hesitation, or even costly mistakes when trading without a clear plan.
But here is the truth: technical analysis isn’t about predicting the future with perfect accuracy. It is about building a structured skill set that helps you make smarter, more confident decisions in a volatile market. This article is designed to cut through the noise, simplify the jargon, and provide practical tools to help you learn step by step. Whether your goal is short-term trading or long-term investing, these insights will help you understand the essentials, avoid common pitfalls, and apply technical analysis with clarity and confidence.
Let’s set the stage for your journey into crypto TA, turning what feels daunting today into a skill you can master tomorrow.
Why You Should Learn Crypto Technical Analysis
Crypto markets are fast-moving, highly volatile, and often driven by sentiment. Without a structured approach, traders risk making impulsive decisions. Technical analysis (TA) provides the tools to navigate this uncertainty with clarity and discipline.
- Making Informed Decisions: TA uses price charts, indicators, and patterns to identify trends and market sentiment. Instead of relying on rumors or emotions, traders base their decisions on measurable signals. Tools like support/resistance levels and stop-loss placement help minimize losses.
- Timing Entries and Exits: Indicators such as RSI, MACD, and moving averages highlight when assets are overbought or oversold. Chart patterns (e.g., triangles, head-and-shoulders) signal potential breakouts or reversals. TA helps traders enter at optimal points and exit before momentum fades.
- Reducing Emotional Trading: A structured strategy prevents panic selling or FOMO-driven buying. Traders trust their analysis rather than reacting to short-term noise. Following TA rules builds habits that reduce stress and emotional swings.
- Importance for Short-Term Gains: TA provides quick signals for intraday moves, and crypto’s sharp price swings become opportunities when guided by chart analysis. This results in profit optimization as short-term strategies rely heavily on precise technical setups.
- Building Long-Term Strategy: TA helps investors spot macro trends (bull vs. bear cycles). Long-term holders can use TA to accumulate during dips and avoid buying at peaks. Understanding cycles fosters confidence in holding through volatility.
Learning crypto technical analysis is not about predicting the future perfectly; it is about stacking probabilities in your favor. It empowers traders to:
- Act with clarity instead of emotion
- Time trades with precision
- Build both short-term profits and long-term resilience
Technical Analysis vs Fundamental: The Difference
Both technical analysis (TA) and fundamental analysis (FA) are essential approaches to understanding crypto markets, but they serve different purposes and are most effective in different scenarios.
| Approach | Best For | Example Scenario |
| Technical Analysis | Short-term trading, scalping, swing trades | Timing entry/exit during Bitcoin volatility |
| Fundamental Analysis | Long-term investing, portfolio building | Evaluating Solana’s ecosystem growth before holding for 5+ years |
| Combined Approach | Balanced strategy | Using TA to enter at a dip while FA confirms the project’s long-term strength |
Technical Analysis (TA)
Focus: Price charts, trading volume, and historical market data.
Goal: Identify patterns, trends, and signals to predict short-term price movements.
Tools:
- Candlestick charts
- Indicators (RSI, MACD, Moving Averages)
- Support & resistance levels
- Chart patterns (triangles, head-and-shoulders, flags)
Example Use Case:
- A trader wants to time an entry into Bitcoin during a breakout.
- They analyze the RSI to determine whether BTC is overbought and review support levels to place a stop-loss.
- TA helps them determine the optimal time to buy or sell.
Fundamental Analysis (FA)
Focus: The underlying value and strength of a crypto project.
Goal: Assess long-term viability and growth potential.
Factors Considered:
- Team & leadership: Who is building the project?
- Use case & utility: Does the token solve a real problem?
- Tokenomics: Supply, demand, staking, and burn mechanisms.
- Community & adoption: Size and engagement of the user base.
- Partnerships & roadmap: Future plans and integrations.
Example Use Case:
- An investor is evaluating Ethereum for long-term holding.
- They study its smart contract ecosystem, developer activity, and upcoming upgrades (like scaling solutions).
- FA helps them assess whether ETH has strong fundamentals that will hold up over the long term.
Core Concepts to Master for Technical Analysis Learning
To build a strong foundation in crypto technical analysis, traders must understand the core building blocks that shape market behavior. These concepts provide the framework for interpreting price action, timing trades, and managing risk.
Price Charts: Candlesticks & Chart Types
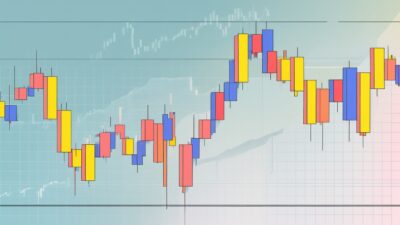
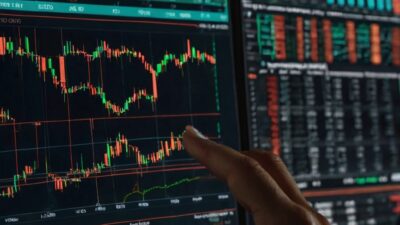
Candlestick charts show open, high, low, and close prices for a given time frame. Other chart types include line charts (a simpler view of closing prices) and bar charts (similar to candlesticks but less visually complex).
Candlesticks reveal market psychology, whether buyers or sellers are in control. Patterns such as doji, engulfing, and hammer signal potential reversals or continuations. Mastering chart types helps traders choose the right visualization for their strategy.
Support and Resistance Levels
A support level is a price level at which buying interest prevents further declines. While a resistance level is a price level where selling interest caps upward movement.
These levels act as decision zones for entries, exits, and stop-loss placement. They help traders anticipate breakouts (price moving above resistance) or breakdowns (price moving below support). Identifying these levels reduces guesswork and adds structure to trading.
Trends and Trendlines
A trend is the general direction of price movement (up, down, or sideways). Trendlines are diagonal lines drawn on charts to connect price points and visualize direction.
Trends define the market environment and indicate whether traders should look for buying opportunities (bullish) or selling opportunities (bearish). Trendlines help confirm momentum and identify potential trend reversals. Following the trend prevents traders from fighting market momentum.
Volume Analysis
Volume measures the number of coins/tokens traded during a specific period. It reflects the strength or weakness behind price movements.
High volume during a breakout confirms strong conviction in the move. Low volume may signal a false breakout or weak trend. Volume analysis helps traders distinguish between noise and meaningful moves.
Technical Indicators You Can Start With
Technical indicators are essential tools for traders seeking to interpret crypto market behavior and make informed decisions. They provide mathematical calculations based on price, volume, or volatility, helping traders identify trends, momentum, and potential reversal points. For beginners, these indicators act as a roadmap, guiding them through the often unpredictable movements of digital assets.
By learning how to interpret these signals, traders can reduce emotional decision-making and rely on structured, data-driven insights. While no indicator guarantees success, combining them with sound risk management strategies can significantly improve both short-term trading outcomes and long-term investment planning.
Moving Averages (MA & EMA)
Moving averages are among the most fundamental tools in technical analysis, designed to smooth price data and highlight the underlying trend. A Simple Moving Average (SMA) calculates the average closing price over a set period, while an Exponential Moving Average (EMA) gives more weight to recent prices, making it more responsive to current market conditions.
Traders often use moving average crossovers, such as when a short-term EMA crosses above a long-term SMA, to signal potential entry points, while the opposite crossover may suggest an exit. For beginners, moving averages are invaluable because they simplify noisy price action and provide clear signals about whether the market is trending upward, downward, or sideways.
RSI (Relative Strength Index)
The Relative Strength Index (RSI) is a momentum oscillator that measures the speed and magnitude of price movements on a scale from 0 to 100. Typically, values above 70 indicate that an asset is overbought, while values below 30 suggest it is oversold. Traders use RSI to anticipate potential reversals, as extreme readings often precede corrections or trend changes.
For example, if Bitcoin’s RSI climbs above 70, it may signal that buyers are exhausted and a pullback is likely. Conversely, an RSI below 30 could indicate that selling pressure is overdone, presenting a buying opportunity. For new traders, RSI is helpful because it provides a straightforward way to gauge market sentiment and avoid chasing prices at unsustainable levels.
MACD
The Moving Average Convergence Divergence (MACD) is a versatile indicator that measures momentum and trend direction using two moving averages and a histogram. It consists of the MACD line, the signal line, and the histogram that shows the difference between the two. When the MACD line crosses above the signal line, it often indicates bullish momentum, while a crossover below suggests bearish momentum.
The histogram helps visualize the strength of these signals, expanding when momentum is strong and contracting when it weakens. For beginners, MACD is particularly useful because it combines trend-following and momentum analysis into a single indicator, helping traders determine whether a trend is gaining strength or losing momentum before making a move.
Bollinger Bands
Bollinger Bands are a volatility indicator that uses a moving average as the center line, with two bands plotted at standard deviations above and below it. These bands expand when volatility increases and contract when volatility decreases. When the price touches or crosses the upper band, it may signal the asset is overextended and due for a pullback, while a touch of the lower band can suggest oversold conditions.
Traders also watch for squeezes, where the bands contract tightly, often preceding a breakout. For beginners, Bollinger Bands are helpful because they provide a visual representation of volatility and help identify whether price movements are strong trends or temporary fluctuations.
Fibonacci Retracement
Fibonacci retracement levels are based on mathematical ratios derived from the Fibonacci sequence and are commonly used to identify potential support and resistance zones after significant price swings. Traders plot these levels, such as 38.2%, 50%, and 61.8%, on a chart to anticipate where the price might retrace before continuing its trend.
For example, if Ethereum rallies from $1,000 to $2,000, traders may look for a retracement to the 61.8% level around $1,382 as a potential entry point. This tool is valuable for beginners because it provides a structured way to plan trades, helping them avoid random entries and instead focus on areas where the market is statistically more likely to react.
Different Ways to Learn Crypto Technical Analysis
Learning crypto technical analysis can feel overwhelming at first because of the sheer number of tools, patterns, and strategies available. Fortunately, there are multiple ways to build your skills, each with its own strengths and limitations. The key is to combine different learning methods so you gain both theoretical knowledge and practical experience. Below are some of the most effective approaches, along with their pros and cons.
Learning With Free Guides and Articles
Free guides and articles are often the first step for beginners who want to build vocabulary and understand the fundamentals of technical analysis. They provide accessible explanations of concepts like candlestick patterns, support and resistance, and indicators without requiring upfront investment. The downside, however, is that this information can feel scattered and overwhelming without a clear roadmap.
Beginners may jump between topics without mastering any of them. To make this method effective, it’s best to follow a single, structured series of articles and apply each concept directly to a chart the same day. This way, learning becomes active rather than passive, and knowledge sticks faster.
Using Communities for Tips and Experiences
Crypto communities, whether on Discord, Telegram, or Reddit, can accelerate learning by exposing traders to real examples, feedback, and diverse perspectives. Seeing how others interpret charts helps beginners understand different approaches to technical analysis. The major risk, however, is blindly copying signals or trading on hype, which often leads to losses.
Communities should be used as a place to ask “why” questions, compare chart ideas, and test your own analysis against others. By engaging critically rather than outsourcing decisions, traders can benefit from collective wisdom while still developing independent judgment.
Taking Technical Analysis Courses for Structured Learning
Courses offer a structured progression that reduces overwhelm and ensures learners cover all the essentials in order: charts → levels → indicators → strategies → risk management. This step-by-step approach helps beginners avoid knowledge gaps and build confidence systematically. The downside is that courses vary widely in quality, and some can be expensive without delivering practical value.
To maximize benefit, learners should choose courses that include practice tasks, real-world chart examples, and opportunities to apply concepts immediately. A good course should not just teach theory but also guide students in building repeatable trading habits.
Learning With Video Tutorials on YouTube
YouTube is a powerful resource for visual learners who benefit from seeing technical analysis applied in real time. Tutorials often demonstrate chart setups, indicator usage, and trading strategies in an easy-to-follow format. The challenge is that it is easy to binge-watch videos without practicing, which leads to a shallow understanding.
To avoid this trap, learners should commit to one playlist, pause frequently, and recreate every example on BTC or ETH charts. This transforms passive watching into active skill-building, ensuring that concepts are not just understood but also applied in practice.
Using Paper Trading and a Trading Journal
Paper trading allows beginners to practice execution skills without financial risk, making it an essential step before committing real capital. It helps traders build confidence in applying technical analysis while avoiding costly mistakes. A trading journal complements this by tracking performance and identifying behavioral patterns. Traders should record the reason for entry, stop-loss placement, target, result, and include a screenshot of the chart.
Over time, this documentation reveals repeated mistakes and highlights strategies that work best. Together, paper trading and journaling accelerate improvement by turning every trade into a learning opportunity.
What’s the Best Path Then?
While there’s no single “best” way to learn crypto technical analysis, since every trader’s journey depends on their goals, time, and learning style, there is a practical path that balances foundational knowledge with structured progression.
The most effective approach begins with learning the basics: terms, glossary, definitions, and simple chart concepts. Free guides, articles, and tutorials are well-suited to this stage because they help you build vocabulary and understand the fundamentals of technical analysis. This early exposure ensures you don’t feel lost when encountering more advanced tools later.
Once you have established that foundation, the next step is to enroll in a reliable, structured course. A well-designed program (like the ones Dypto offers) provides a clear roadmap: starting with charts, then moving to support/resistance, indicators, strategies, and finally risk management. This progression reduces overwhelm and ensures you’re not just collecting random knowledge but building a skill set in the right order.
By combining self-study for fundamentals with a structured course for application, you create a balanced learning path. You gain both the flexibility of free resources and the discipline of guided instruction, making it easier to transition from theory to practice and, eventually, from beginner to confident trader.
Start with free guides to master the language of technical analysis, then invest in a structured course to apply those concepts systematically. This blended path provides clarity, confidence, and a strong foundation for both short-term trading and long-term strategy development.
Mistakes to Avoid While Learning Crypto Technical Analysis
Learning technical analysis is a journey, and beginners often stumble on common pitfalls that slow progress or lead to unnecessary losses. The good news is that each mistake has a simple fix. Here are the most practical ones to watch out for:
- Chasing Perfect Predictions: Beginners often expect technical analysis to predict exact price movements. When trades don’t play out perfectly, they lose confidence. Shift your mindset, as TA is about probabilities, not certainties. Focus on stacking odds in your favor and managing risk, not predicting the future.
- Using Too Many Indicators at Once: Overloading charts with 5–10 indicators creates confusion and conflicting signals. Start with two or three core indicators (e.g., Moving Averages, RSI, MACD). Learn how each works individually before combining them.
- Ignoring Risk Management: Beginners often trade without stop-losses or risk limits, resulting in significant losses. Always set a stop-loss before entering a trade. Risk no more than 1–2% of your capital per trade to stay in the game long-term.
- Trading Without a Plan: Jumping into trades based on emotion or hype instead of a structured strategy. Write down a trading plan including entry reason, stop-loss, target, and exit rules. Stick to it, even when emotions push you to deviate.
- Ignoring Volume Analysis: Beginners focus only on price and forget that volume confirms the strength of moves. Always check volume alongside price action. A breakout with high volume is more reliable than one with weak participation.
- Not Practicing on Paper Trades: Jumping straight into live trading without practice often leads to costly mistakes. Use paper trading platforms to test strategies risk-free. Track results in a journal to refine your approach before risking real money.
- Copying Signals Blindly: Beginners often follow community signals or influencers without understanding the reasoning. Use signals as learning material, not shortcuts. Ask “why” the trade was suggested and compare it with your own chart analysis.
Avoiding these mistakes isn’t about becoming perfect; it is about building discipline, skill, and confidence. Technical analysis is a tool to guide decisions, not a crystal ball. By focusing on structured learning, risk management, and consistent practice, you’ll progress faster and avoid the traps that hold most beginners back.
Tools and Software to Support Your TA Learning
Learning crypto technical analysis isn’t just about theory; it is about using the right tools to practice, refine, and track your progress. The following categories of tools can significantly shorten your learning curve by making analysis more structured and actionable.
Charting Platforms
- Purpose: Charting platforms (like TradingView) let you visualize price action, apply indicators, and draw trendlines.
- How It Helps: They provide a canvas for all your technical analysis, making it easier to spot patterns and test strategies.
- Setup Tip: Start with a clean chart, including candlesticks, one moving average, and volume. Add complexity only after mastering basics.
Screeners
- Purpose: Crypto screeners filter coins based on criteria like volume, RSI, or moving average crossovers.
- How It Helps: They save time by highlighting assets that fit your trading strategy instead of manually scanning dozens of charts.
- Setup Tip: Configure a screener to show the top 10 coins by volume each day. This keeps your focus on liquid assets with meaningful moves.
Alerts
- Purpose: Alerts notify you when the price hits a level, an indicator triggers, or volatility spikes.
- How It Helps: They prevent missed opportunities and reduce the need to constantly monitor charts.
- Setup Tip: Set alerts at key support/resistance levels or when RSI crosses 70/30. This way, you’re only pinged when action matters.
Backtesting Tools
- Purpose: Backtesting software lets you test strategies against historical data to see how they would have performed.
- How It Helps: It validates your approach before you risk real money, highlighting your system’s strengths and weaknesses.
- Setup Tip: Start by backtesting one simple strategy (e.g., moving average crossover) on BTC/ETH. Refine before adding complexity.
Journaling Apps
- Purpose: Journaling tools (like Edgewonk or even spreadsheets) track your trades, reasons, and outcomes.
- How It Helps: They reveal patterns in your behavior, highlight repeated mistakes, and accelerate improvement.
- Setup Tip: Record entry reason, stop-loss, target, result, and chart screenshot for every trade. Review weekly to spot trends.
Why Dypto Crypto for Technical Analysis Learning?
When it comes to mastering crypto technical analysis, Dypto Crypto stands out as more than just another learning platform; it is a community-driven hub that makes complex concepts accessible, engaging, and practical.
We offer tutorials carefully designed for all levels of experience, whether you are a complete beginner learning candlestick basics or an advanced trader refining your strategy with Fibonacci retracements. Each lesson is structured to build progressively, ensuring you don’t just memorize terms but actually learn how to apply them to real charts.
Learning technical analysis can feel intimidating, but Dypto makes it interactive and enjoyable. With a supportive community, live discussions, and shared chart breakdowns, you will never feel like you are learning alone. The environment encourages asking questions, testing ideas, and celebrating progress together, turning what could be a solitary skill into a collaborative journey.
We emphasize hands-on practice. Tutorials are paired with exercises that encourage you to apply concepts immediately on BTC, ETH, or other crypto charts. This approach ensures that theory translates into skill, helping you build confidence in your own analysis rather than relying on hype or signals.
Dypto Crypto combines expert guidance, structured tutorials, and a vibrant community to help you learn technical analysis in a way that’s both effective and enjoyable. It’s not just about learning charts; it is about building a skill set that empowers you to trade smarter and invest with confidence.
Ready to level up your crypto trading skills? Join Dypto Crypto today and subscribe to the newsletter to stay updated with fresh tutorials, community insights, and exclusive learning resources.
Frequently Asked Questions
What’s the best and quickest way to learn crypto technical analysis?
The best and quickest way to learn crypto technical analysis is to start with free guides for basic terms, then practice daily on charts. Follow a structured course for progression, use paper trading to refine skills, and keep a journal to track mistakes and improvements.
How can I practice crypto technical analysis before actual trades?
Practice crypto technical analysis with paper trading platforms to simulate trades risk-free. Use real charts of BTC/ETH, apply indicators, and record entries, stops, and targets in a trading journal. Reviewing screenshots and outcomes helps identify mistakes, refine strategies, and build confidence before committing real capital.
How long does it take to learn technical analysis for crypto?
Learning crypto technical analysis typically takes a few months of consistent study and practice to grasp the basics, while mastering strategies can take a year or more. Progress depends on daily chart work, journaling, and disciplined practice. Focus on building skills gradually rather than rushing for quick predictions.
What indicators should beginners learn first for crypto?
Beginners should start with Moving Averages to spot trends, RSI to gauge overbought/oversold conditions, MACD for momentum shifts, and Bollinger Bands to understand volatility. These core indicators are simple, widely used, and provide clear signals, helping new traders build confidence and avoid emotionally driven, guesswork-based decisions.
Can I learn crypto technical analysis for free?
Yes, you can learn crypto technical analysis for free through guides, articles, YouTube tutorials, and community discussions. Start with basics like candlesticks, support/resistance, and RSI. Practice daily on charts and use paper trading to apply concepts. Consistency and journaling make free learning effective and skill-building.
Disclaimer
This article is for educational and information purposes, and should not be considered financial advice. For more information visit our disclaimer page
About the Author