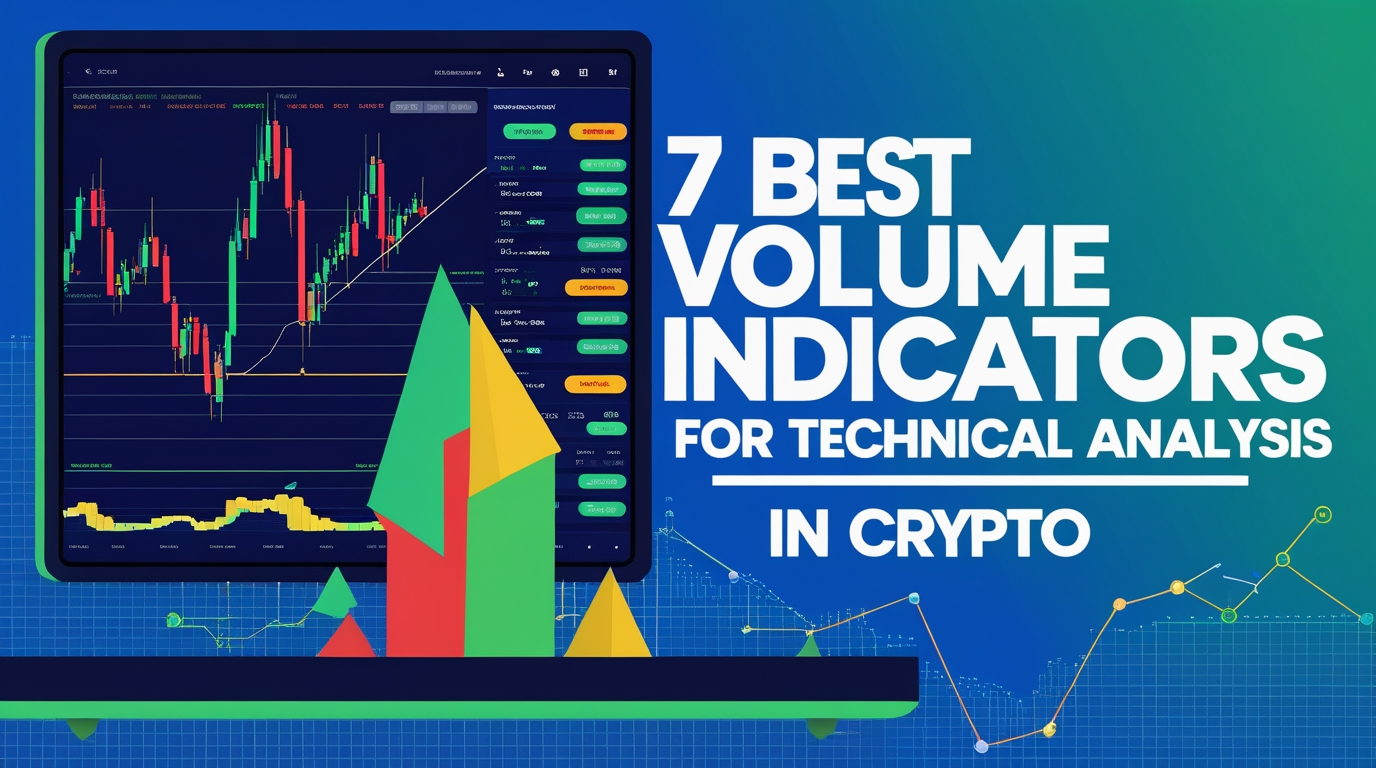
Volume indicators are a key element for expert crypto traders, helping them stay ahead of the market. While price charts help a person understand what has already occurred in the market, volume indicators help them understand the reasons behind it.
Depending solely on the price actions is like driving a car with one eye closed. Volume indicators will enable you to confirm a market’s direction, identify a possible reversal before it occurs, and distinguish whether it’s a true breakout or “fake-out” for the inexperienced trader.
Whether it is scalping Bitcoin, swing trading for alts, or establishing a long position, having the right volume indicators will make all the difference in your decision-making. Below, we will discuss the seven volume indicators that every cryptocurrency trader must familiarize themselves with.
Importance of Volume Indicators in Technical Analysis
Volume indicators measure the strength behind price movements by analysing trading activity. Unlike price-only indicators that track candle patterns or moving averages, volume indicators incorporate the actual number of coins or tokens traded during a specific period.
Think of volume as the fuel behind price movements. Without strong volume backing a move, it’s like a car running on fumes. Conversely, when price breaks out with massive volume support, it signals genuine market interest and commitment.
Volume indicators offer these important functions:
- Trend Confirmation: Trends can be confirmed by observing strong volume in the direction of the trend. Strong volume means that the move is genuine.
- Reversal Detection: If the volume is decreasing during a trend or spikes at extremes, it can also signal exhaustion.
- Breakout Validation: The high-volume during breakouts shows that there is genuine interest versus low-volume fake-outs.
- Support/Resistance Strength: Volume analysis reveals which price levels hold the most trading activity.
The beauty of volume indicators is that they cut through market noise and manipulation attempts. It’s much harder to fake sustained volume than to pump a price temporarily.
7 Best Volume Indicators Every Crypto Trader Should Know
There’s no single “best” volume indicator for every situation. These seven tools offer unique insights into the complex dynamics of the market. The table shows a quick overview.
| Indicator | Best For | What It Shows | Complexity |
| On-Balance Volume (OBV) | Trend trading, divergence spotting | Cumulative buying vs. selling pressure | Beginner |
| Volume Weighted Average Price (VWAP) | Day trading, scalping | Intraday fair value and support/resistance | Beginner |
| Volume Profile (VPVR) | Swing trading, identifying value areas | Volume distribution by price level | Intermediate |
| Money Flow Index (MFI) | Overbought and the oversold conditions | Volume-weighted momentum | Intermediate |
| Chaikin Money Flow (CMF) | Accumulation/distribution phases | Money flow strength and direction | Intermediate |
| Accumulation/Distribution Line | Detecting hidden demand | Cumulative demand tracking | Intermediate |
| Ease of Movement (EOM) | Breakout trading | Price movement efficiency relative to volume | Advanced |
1. On-Balance Volume (OBV) – Classic Volume Trend Indicator
Image source: Fidelity
On-Balance Volume is a powerful yet simple volume indicator. OBV basically adds volume on up days and subtracts the volume on down days. This creates a cumulative line that can easily show buying versus selling pressure.
When a crypto closes higher than the previous candle, OBV adds that period’s volume to the running total. When it closes lower, that volume gets subtracted.
How traders utilize OBV in crypto:
- Trend Confirmation: When the price and OBV both make higher highs, then the uptrend is confirmed by true buying pressure.
- Divergence Spotting: If Bitcoin makes a new high but OBV does not, it indicates weakening momentum.
- False Breakout Filter: A breakout where there is rising OBV is more reliable than one where OBV stays flat
While in consolidation, if OBV continues to rise and price remains range-bound, it signals accumulation prior to a possible breakout. Meanwhile, falling OBV during consolidation warns of distribution.
2. Volume Weighted Average Price (VWAP) – Intraday Fair Value for Crypto
Image source: BlogUeex
VWAP calculates the average price at which a crypto has traded throughout the session, weighted by volume at each price level. This creates a dynamic fair value line that institutional traders and algorithms use as a reference.
When the price is above VWAP, buyers are in control, and the asset is trading at a “premium.” However, below VWAP represents a “discount” where sellers can dominate.
Common VWAP strategies in crypto:
- Mean Reversion: When price strays far from VWAP, you can expect pullbacks toward this fair value anchor.
- Support/Resistance: The VWAP acts as dynamic support in uptrends and as dynamic resistance in downtrends.
- Entry Timing: Scalpers buy dips to VWAP in uptrends and sell rallies in downtrends.
- Avoiding FOMO: If the price is 5% above VWAP, you might be chasing. You should wait for a pullback in this case.
Pro tip: Remember that VWAP resets each day, which makes it an intraday tool. For longer timeframes, you should consider anchored VWAP from important events.
3. Volume Profile (VPVR) – Volume by Price Levels, Not Time
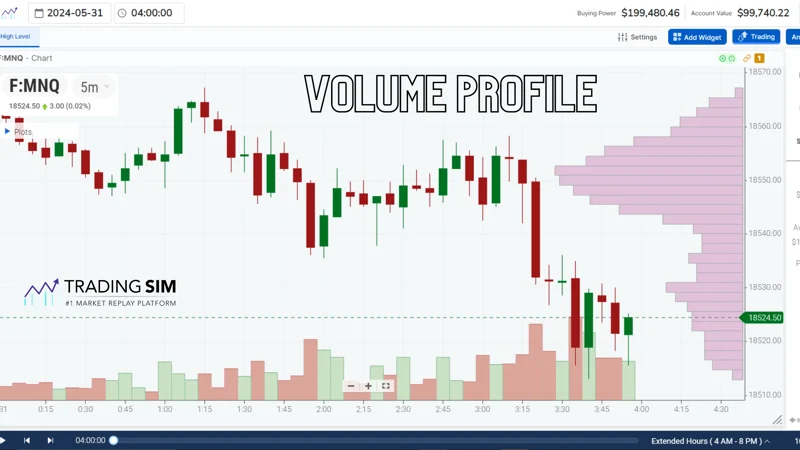
Image Source: TradingSim
Unlike traditional volume bars, which show activity per time period, the Volume Profile displays total volume traded at each price level. This creates a horizontal histogram revealing where the most trading activity occurred.
The high-volume areas are called “high-volume nodes” or “value areas”, these represent price levels where traders found equilibrium. Meanwhile, the low-volume areas show prices that were quickly rejected, often acting as weak support/resistance.
How to use Volume Profile in crypto trading:
- Value Area: The price range that contains roughly 70% of volume acts as a magnet, pulling price back during retracements.
- Point of Control (POC): The price with the most volume serves as strong support or resistance.
- Low Volume Nodes: You should expect fast moves through these areas with minimal resistance.
- Entry/Exit Planning: Buy at the bottom of value areas, sell at the top, place stops beyond high-volume nodes.
If Ethereum traded heavily between $3,200 and $3,400 before rallying to $3,800, that original price range will most likely provide support on any pullback.
4. Money Flow Index (MFI) – Volume-Weighted RSI
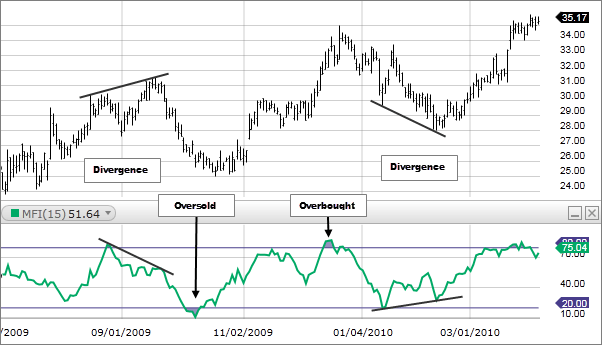
Image Source: Investing
The Money Flow Index uses both price and volume to show whether an asset is overbought or oversold. It works similar to RSI, but it also considers trading volume. The MFI ranges from 0 to 100. Above 80 indicates overbought, while below 20 indicates oversold.
Effective MFI applications:
- Divergence Signals: Price making higher highs while MFI makes lower highs warns of exhausted momentum
- Extreme Readings: MFI above 90 in parabolic rallies often come before sharp corrections.
- Trend Strength: During healthy uptrends, MFI typically ranges from 40 to 80.
- Entry Refinement: In range-bound markets, buy when MFI dips below 20 and sell when it exceeds 80.
Because MFI incorporates volume, it’s particularly useful in crypto, where volume surges often precede major moves.
5. Chaikin Money Flow (CMF) – Spotting Accumulation and Distribution
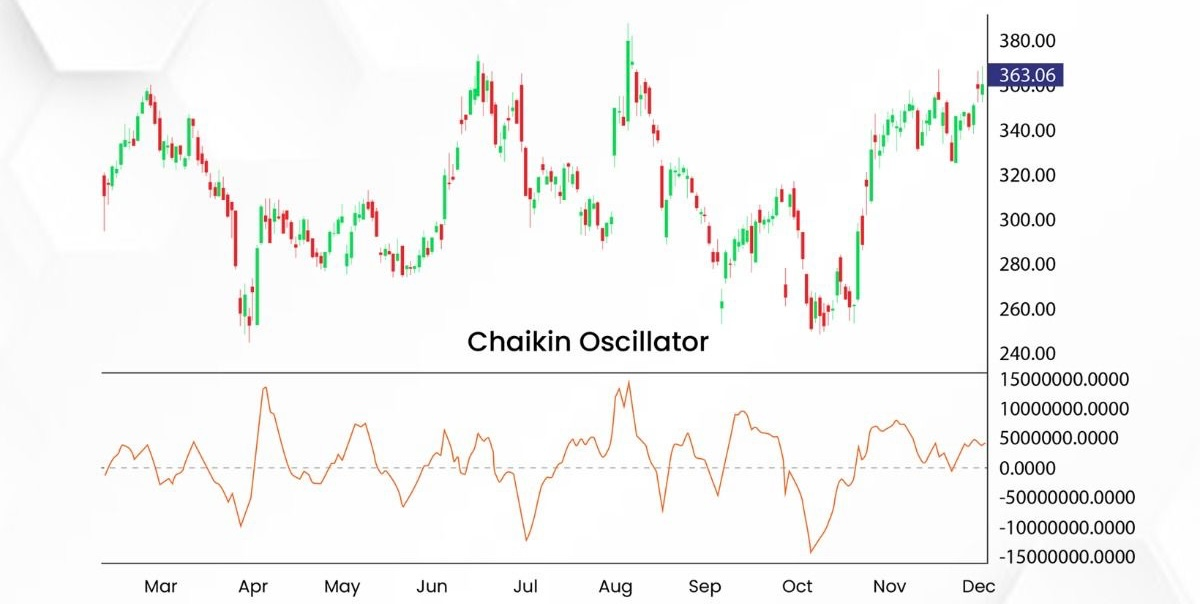
Image Source: UEEX
Chaikin Money Flow calculates the flow of money into and out of a cryptocurrency over a set period (usually 21 days), based on the closing price relative to each candle’s overall range, weighted by volume.
If prices are closing near the upper part of the candle and with high volume, the CMF will increase (indicating accumulation). Meanwhile, the bottom part closes, pushing the CMF into negative territory (distribution).
CMF trading insights:
- Positive CMF: Money flowing in; buying pressure dominates.
- Negative CMF: Money flowing out; selling pressure leads.
- Zero Line Crosses: CMF crossing above zero signals accumulation; crossing below warns of distribution.
- Divergence: Prices advancing while CMF falls can suggest a trend reversal.
If the price of an altcoin starts to move sideways and the CMF remains in the positive zone (+0.15 to +0.20), it indicates ongoing buying in the altcoin market. When the breakthrough finally comes, the positive CMF makes the resultant move more reliable.
6. Accumulation/Distribution Line – Tracking Real Demand Behind Price
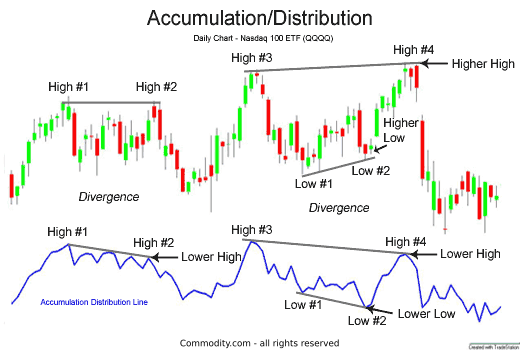
Image Source: Commodity
The Accumulation/Distribution (A/D) Line uses price position within the candle range and volume to show whether a crypto is being accumulated or distributed over time.
Unlike OBV, which only considers closing price direction, A/D looks at where the price closed within the high-low range. A close near the high with volume suggests strong buying; near the low indicates selling pressure.
A/D Line applications:
- Divergence Detection: Price making new lows while A/D rises reveals hidden accumulation
- Trend Confirmation: A/D following price confirms the trend’s strength
- Flat Price Analysis: When price consolidates, but A/D steadily rises or falls, it forecasts the next move
- Altcoin Bottoms: Rising A/D during sideways price action after a downtrend often precedes reversals
7. Ease of Movement (EOM) – How Easily Price Moves on Given Volume
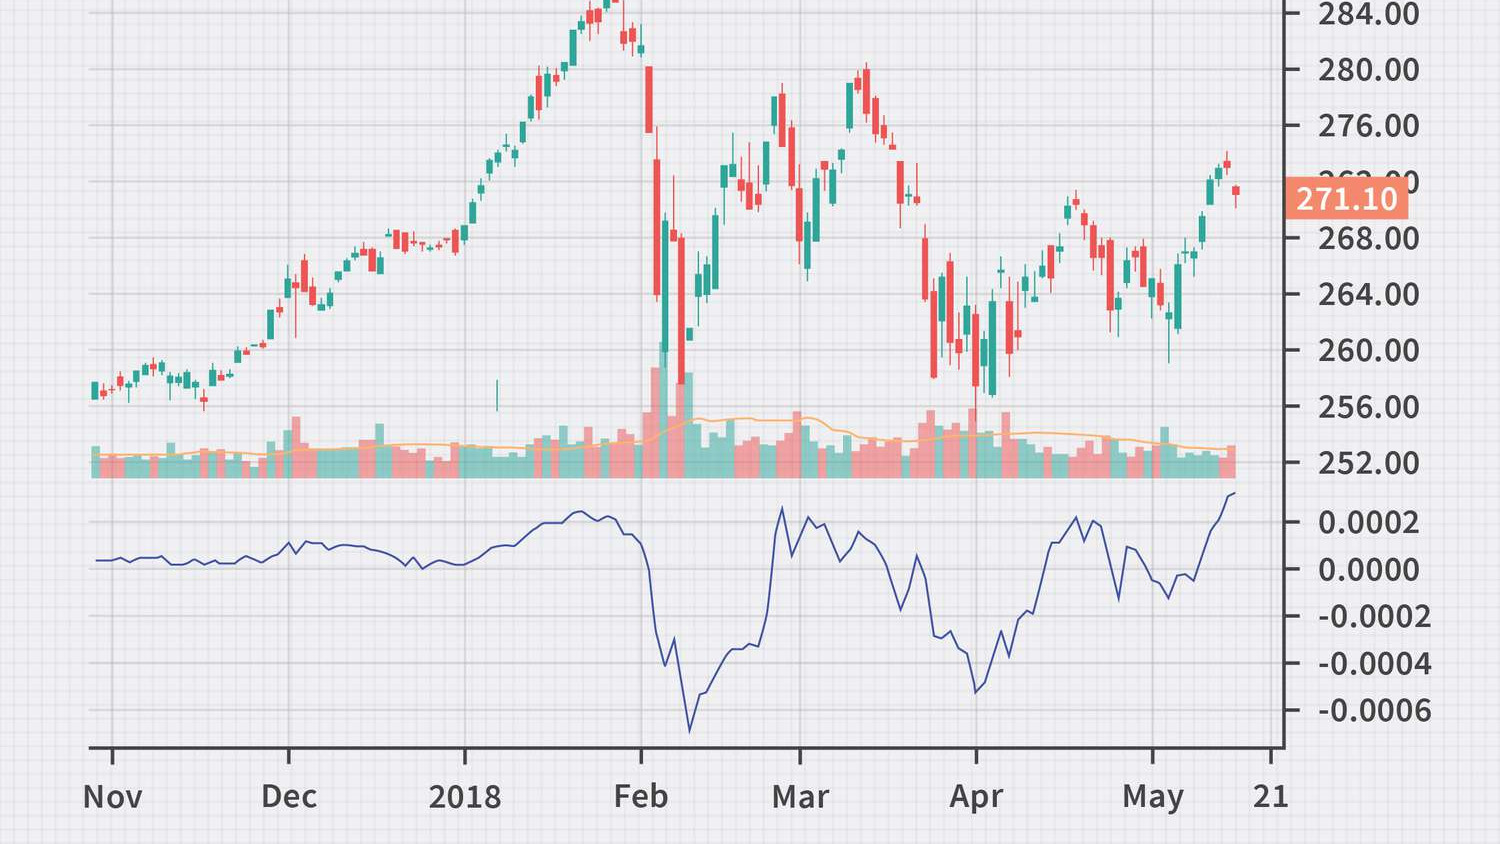
Image Source: Investopedia
Ease of Movement quantifies the relationship between price change and volume, revealing how much volume is required to move the price a given distance. High positive EOM values indicate the price is rising easily with little volume, while negative values indicate the price is falling easily.
When EOM is high during an advance, it suggests natural buying interest with minimal resistance. Low or negative EOM during rallies warns of potential exhaustion.
EOM trading strategies:
- Breakout Confirmation: Rising EOM as price breaks resistance suggests the move is sustainable.
- Divergence Signals: Price making new highs while EOM declines indicates increasing resistance.
- Efficiency Analysis: Consistently high EOM in one direction indicates a healthy trend.
- Reversal Warning: Drops in EOM may happen suddenly in trending markets prior to market reversal.
EOM should be combined with trend-following techniques, such as moving averages, for confirmation.
Pairing Volume Indicators with Other Technical Tools
Volume indicators become more powerful when combined with complementary technical tools. Here are proven pairings:
OBV + Moving Averages: Use OBV to confirm trend direction while MAs define the trend. When the price is above the 200-day MA and OBV makes higher highs, you have strong confirmation of an uptrend.
VWAP + RSI: Wait for RSI oversold readings (below 30) AND price to touch VWAP before buying. This combines momentum exhaustion with fair value.
Volume Profile + Fibonacci Retracements: Look for confluence with Volume Profile value areas. When a 61.8% retracement aligns with a high-volume node, that support/resistance becomes more significant.
MFI + MACD: Use MACD for trend direction while MFI confirms money flow supports the move. MACD crossovers with MFI in favorable territory (>50 for longs, <50 for shorts) provide robust signals.
CMF + Support/Resistance: When price approaches key support, and CMF is positive, buyers are accumulating, strengthening that level. A negative CMF at resistance suggests it’s likely to hold.
Example Volume Indicator Setups for Different Crypto Trading Styles
Scalping Setup (1-5 minute charts):
- Primary Indicator: VWAP
- Secondary: Volume bars
- Strategy: Buy dips to VWAP in uptrends when volume spikes show strong demand. Take profit at 0.5-1% above entry.
Day Trading Setup (15-minute to 1-hour):
- Primary: OBV + VWAP
- Secondary: MFI
- Strategy: Trade in the direction of the OBV trend. Enter when price pulls back to VWAP and MFI shows oversold (<20) or overbought (>80). Target the previous swing high/low.
Swing Trading Altcoins (4-hour to daily):
- Primary: Volume Profile + CMF
- Secondary: A/D Line
- Strategy: Identify value areas on Volume Profile. Buy near the value area low when CMF turns positive, and A/D confirms accumulation.
Long-Term Position Building:
- Primary: OBV + A/D Line
- Secondary: Weekly volume trends
- Strategy: Accumulate when OBV and A/D both rise during consolidation phases. This signals smart money accumulation.
Some Volume Indicator Myths and Reality Checks
Myth: “High volume always confirms the move”
Reality: Not all volume is created equal. High volume during distribution or panic selling indicates bearish pressure, not bullish confirmation. Context matters; you need to analyze volume in relation to price action and trend direction.
Myth: “More indicators equals better accuracy”
Reality: Using multiple volume indicators simultaneously creates confusion. Most indicators are derived from the same raw data and give redundant signals. As a best practice, you should choose 1-2 volume indicators that suit your trading style and master them.
Myth: “Volume indicators work the same across all crypto assets”
Reality: Low-cap altcoins with thin liquidity behave differently from Bitcoin or Ethereum. Volume indicators can give false signals on illiquid pairs, where a single large order can create artificial spikes.
Myth: “You can trade profitably using only volume indicators”
Reality: Volume indicators are very good confirmation tools, but they shouldn’t be your only criterion. They perform best when used in conjunction with analysis of price action, support and resistance levels, or trend-following indicators.
Myth: “Volume divergences always lead to reversals”
Reality: Although divergences usually occur prior to reversals, they may remain in place for a long time during strong trends. Consider divergences as warning signals to tighten risk management rather than as signals for reversals.
Want to Learn More About Crypto Trading? Join Dypto Crypto for Free
Mastering volume indicators is the missing piece between successful traders and those who have not reached this level yet. By learning to read the buying and selling pressure of price movement, you are ahead of the game in the markets.
The seven volume indicators we have covered, namely OBV, VWAP, Volume Profile, MFI, CMF, A/D Line, and EOM, all provide different insights into the market. Again, pick one or two that suit your trading style and then learn the others in time to build your toolset.
Ready to take your crypto trading education to the next level? By joining Dypto Crypto for free, you’ll tap into an incredible community of serious traders. We make learning fun, engaging, and applicable to the real world through real-world examples, market analysis, and strategies you can implement immediately. Whether you are a beginner looking to craft your approach or a more seasoned trader looking to refine it, Dypto Crypto has the resources and support you need to succeed in cryptocurrency trading.
Frequently Asked Questions
What is the most accurate volume indicator for crypto trading?
There is not one “most accurate” volume indicator; everything depends on your trading style and market conditions. Trend traders will find good confirmation in OBV. Day traders prefer using the VWAP as an intraday fair value indicator. Swing traders find insights from Volume Profile useful. The best solution would be combining 2-3 complementary indicators.
Which volume indicator is best for day trading or scalping?
VWAP is the preferred volume indicator in the world of day traders and scalpers because it generates levels of intraday support and resistance on an ongoing daily basis, which keeps changing daily. Numerous profitable scalpers prefer to use OBV to quickly confirm market trends on the 5-minute or 15-minute chart.
Can I trade using only volume indicators?
Although volume indicators provide useful information, it is not advisable to base trading decisions solely on them. They are good indicators, but should be considered together with price action analysis and support and resistance levels analysis. A balanced approach yields the best results.
Do volume indicators work on every crypto and timeframe?
Volume indicators can be used for most types of crypto across a wide range of time frames, but their reliability varies. These are best utilized on liquid assets such as Bitcoin, Ethereum, or major altcoins. On low-cap altcoins with thin volume, indicators can give false signals from single large trades. They’re generally most reliable on 15-minute charts and above, where noise is reduced.
Disclaimer
This article is for educational and information purposes, and should not be considered financial advice. For more information visit our disclaimer page
About the Author