
Remember when the Stock-to-Flow model predicted Bitcoin would hit $100,000 by 2021? Yeah, that didn’t happen. Bitcoin peaked around $69,000, then crashed to $15,000 by 2022. Suddenly, the once-celebrated model that had crypto Twitter buzzing looked pretty broken.
But here’s the thing, for years before that miss, Stock-to-Flow (S2F) was scary accurate. It predicted Bitcoin’s 2017 rally, called the 2020 bull run, and became the go-to framework for understanding Bitcoin’s value based on scarcity. Traders loved it. Investors quoted it. The model’s creator, PlanB, became a legend in crypto circles.
So what happened? Did the model actually break, or did everyone just misuse it? Is scarcity still a meaningful driver of Bitcoin’s price, or have market dynamics evolved beyond simple supply models?
These questions matter because Stock-to-Flow isn’t just some obscure theory. It shaped how millions of people think about Bitcoin’s value proposition. Understanding whether it still works, and why it might have limitations, helps you make better decisions about Bitcoin’s future price potential.
In this guide, we’ll break down everything about the Bitcoin Stock-to-Flow model. What it is and how it works, its track record of predictions (the hits and the spectacular misses), how traders actually use it in practice, why it became so popular in the first place, the major criticisms that emerged after 2021, and whether it still holds any value today.
By the end, you’ll understand both the model’s insights and its blind spots, which is exactly what you need to avoid getting caught up in hype or dismissing useful frameworks entirely.
Let’s dive in.
What is the Bitcoin Stock-to-Flow Ratio?
- The Stock-to-Flow (S2F) ratio is a scarcity metric borrowed from commodities like gold and silver.
- It measures the relationship between:
- Stock → total existing supply
- Flow → annual new production
- Stock → total existing supply
- A higher S2F ratio = higher scarcity, which theoretically increases value.
How Stock-to-Flow Is Calculated
- Formula:
- S2F = Stock ÷ Annual Flow
- S2F = Stock ÷ Annual Flow
- Gold example:
- 200,000 tons of above-ground stock
- 3,000 tons mined per year
- S2F = 66 → It would take 66 years of production to double the supply.
- 200,000 tons of above-ground stock
- Silver example:
- S2F = 22 → Less scarce than gold due to higher relative annual production.
- S2F = 22 → Less scarce than gold due to higher relative annual production.
Why Bitcoin Fits Into the Stock-to-Flow Model
- Bitcoin’s supply issuance is predictable and declines over time.
- Every 210,000 blocks (4 years), a halving occurs:
- Block reward is cut in half
- Flow decreases sharply
- Stock continues increasing
- S2F ratio jumps higher after every halving
- Block reward is cut in half
- Over time, Bitcoin becomes progressively scarcer, theoretically even more than gold.
PlanB and the Popularization of S2F
- A pseudonymous analyst PlanB popularized S2F for Bitcoin in 2019.
- He:
- Plotted Bitcoin’s historical price against its S2F ratio
- Found a strong correlation
- Noted that price appeared to follow a power-law trend driven by increasing scarcity
- Plotted Bitcoin’s historical price against its S2F ratio
- This gave S2F widespread recognition in the crypto world.
Why the Model Became So Popular
- It fits Bitcoin’s narrative as “digital gold.”
- Bitcoin shares key properties with gold:
- Scarce
- Durable
- Resistant to manipulation
- Scarce
- But Bitcoin goes further:
- Scarcity is mathematically guaranteed
- Issuance is fixed by protocol
- Halvings are predictable, hard-coded supply shocks
- Scarcity is mathematically guaranteed
- This makes S2F appealing as a long-term valuation model based on scarcity dynamics.
How Stock-to-Flow Ratio Works
Understanding the mechanics behind Stock-to-Flow helps clarify both its appeal and its limitations.
Stock refers to the total amount of Bitcoin currently in existence. As of 2025, roughly 19.6 million Bitcoin have been mined out of the 21 million maximum supply. This number only goes up (ignoring lost coins) as new blocks are mined.
Flow refers to the annual production rate, the new Bitcoin entering circulation each year. This number decreases dramatically every halving. Before the first halving in 2012, 7,200 BTC were mined daily. After the 2024 halving, only 450 BTC are mined daily, that’s just 164,250 BTC annually.
The S2F ratio calculation is straightforward. Divide the current stock by the annual flow. After the 2024 halving, Bitcoin’s S2F ratio jumped to approximately 120. That means at current production rates, it would take 120 years to produce as much Bitcoin as currently exists.
The theory connects scarcity to value through basic supply and demand. If an asset is scarce (high S2F) and demand remains constant or increases, price must rise to balance the market. There simply aren’t enough units available to satisfy demand at the current price.
Gold’s S2F of 66 helps explain its enduring value across millennia. You can’t just flood the market with gold, annual production is tiny relative to existing supply. This makes gold a reliable store of value.
Bitcoin’s S2F increasing from around 25 (pre-2020 halving) to 50 (post-2020) to 120 (post-2024) represents escalating scarcity. Each halving makes Bitcoin demonstrably more scarce than before. If the “digital gold” narrative holds and demand continues, the model suggests price appreciation is inevitable.
PlanB didn’t just show correlation between S2F and price, he found a power-law relationship. When plotted on logarithmic scales, Bitcoin’s price followed a predictable curve relative to its S2F ratio. This mathematical relationship suggested the connection wasn’t random but fundamental.
The power law meant that each doubling of S2F didn’t just double price, it multiplied price by a much larger factor. This exponential relationship explained Bitcoin’s massive bull runs following halvings.
Here’s the graph visualizing how Bitcoin’s stock and flow interact in the Stock-to-Flow (S2F) model:

- The blue line shows total Bitcoin mined (stock) steadily increasing toward the 21M cap.
- The orange dashed line shows the annual production (flow), which drops sharply after each halving.
- The green line (on the secondary axis) shows the resulting S2F ratio, which rises exponentially, illustrating how scarcity increases as new supply dwindles.
This visualization captures why halvings are central to Bitcoin’s scarcity narrative — each one boosts the S2F ratio dramatically, implying stronger scarcity and potential upward pressure on price if demand holds.
Bitcoin Price Prediction Using The S2F Model
Theory is one thing, but how did Stock-to-Flow actually perform in predicting Bitcoin’s price? Let’s look at the track record.
From Bitcoin’s inception through 2020, the S2F model performed remarkably well. Bitcoin’s price generally tracked the model’s predictions within reasonable ranges.
After the 2012 halving, Bitcoin’s S2F increased and price rallied from single digits to over $1,000 by late 2013. The model predicted this appreciation based on the new scarcity level.
Following the 2016 halving, S2F doubled again. Bitcoin’s price climbed from around $450 to nearly $20,000 by December 2017. The magnitude and timing aligned with S2F expectations.
The 2020 halving in May was followed by an explosive rally. Bitcoin went from roughly $9,000 pre-halving to $69,000 by November 2021. The S2F model predicted Bitcoin should trade in the $55,000 to $100,000 range during this cycle based on its new S2F ratio of 50. Bitcoin hit the lower end of that prediction.
Here’s where things got complicated. The S2F model suggested Bitcoin should sustain prices in the $100,000 range or higher post-2020 halving. Instead, Bitcoin peaked at $69,000 in November 2021, then crashed.
By late 2022, Bitcoin had fallen to $15,000, nowhere near the S2F model’s predicted “fair value” around $55,000 minimum. The model seemed broken. Critics who had been skeptical all along pointed to this as proof that S2F was pseudoscience.
What happened? Several factors converged. Macro conditions shifted dramatically. The Fed began raising interest rates aggressively to combat inflation. Risk assets across the board (stocks, crypto, tech) sold off hard. Bitcoin wasn’t immune to this broader market pressure.
The S2F model doesn’t account for any of these factors. It assumes demand remains constant or grows, which didn’t happen in 2022-2023.
Bitcoin’s fourth halving occurred in April 2024, pushing S2F to approximately 120. The model predicted this should drive Bitcoin well above $100,000, potentially toward $500,000 or higher based on some interpretations of the power-law relationship.
As of early 2025, Bitcoin has traded in the $90,000 to $105,000 range. It did reach new all-time highs, which partially validates the scarcity thesis. However, it hasn’t exploded to the extreme valuations some S2F interpretations suggested.
Was S2F accurate? In the early cycles (2012-2020), yes, impressively so. It captured the long-term upward trend and roughly predicted price ranges around each halving. Is it still accurate? That’s debatable. Bitcoin has continued to appreciate over time, which supports the scarcity narrative. But the precision of predictions has broken down.
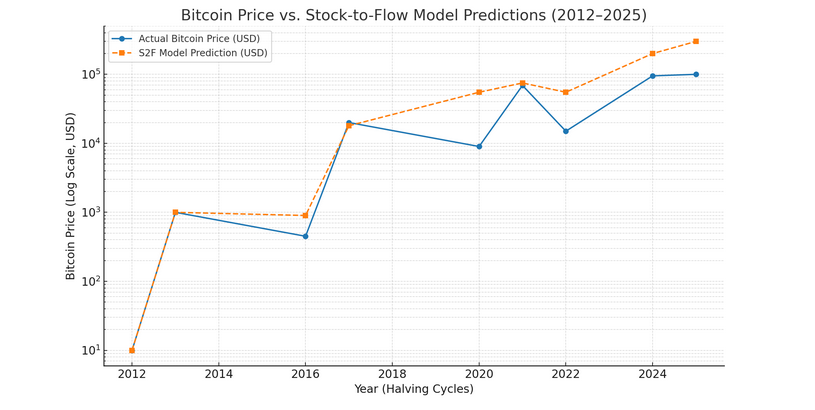
Here’s the chart comparing Bitcoin’s actual historical price to the Stock-to-Flow model predictions from 2012 to 2025:
- The blue line shows real market prices, plotted on a logarithmic scale to capture Bitcoin’s exponential growth and volatility.
- The orange dashed line represents S2F model projections, which increase sharply after each halving as scarcity rises.
- The visualization highlights that while Bitcoin followed the model closely through 2020, post-2021 prices diverged — showing both the model’s strengths and its limitations under changing macro conditions.
How Traders and Investors Use the S2F Model
Despite its limitations, many traders and investors still reference Stock-to-Flow. Here’s how it gets applied in practice.
- S2F is a long-term valuation tool, not a short-term trading indicator.
- It helps investors judge whether Bitcoin is undervalued or overvalued relative to its scarcity.
Interpreting Price vs. S2F Predictions
- Bitcoin trading below S2F prediction:
- Often seen as a buying opportunity.
- Suggests the market is undervaluing Bitcoin’s scarcity.
- Assumes price will eventually revert upward toward “fair value.”
- Often seen as a buying opportunity.
- Bitcoin trading at or above S2F prediction:
- Signals that scarcity is fully priced in.
- Does not mean sell immediately, but indicates limited upside purely based on scarcity.
- Signals that scarcity is fully priced in.
S2F and Halving Cycles
- Post-halving (year after a halving):
- Bitcoin often trades well below S2F model levels.
- Historically represents accumulation phases.
- Bitcoin often trades well below S2F model levels.
- Pre-halving and 12–18 months after halving:
- Bitcoin typically rallies toward or above S2F projections.
- These become distribution phases where long-term holders take profits.
- Bitcoin typically rallies toward or above S2F projections.
Using S2F with Other Tools
- Smart investors do not rely on S2F alone. They combine it with:
- On-chain metrics: accumulation wallets, exchange flows, realized price
- Technical analysis: trendlines, support/resistance, indicators
- Macro factors: Federal Reserve policy, inflation trends, dollar strength
- Sentiment measures: fear & greed index, funding rates
- On-chain metrics: accumulation wallets, exchange flows, realized price
What S2F Really Answers
- S2F answers:
- “Based purely on scarcity, where should Bitcoin trade long-term?”
- “Based purely on scarcity, where should Bitcoin trade long-term?”
- Other tools answer:
- “What is demand, sentiment, and momentum doing right now?”
Strengths That Made the Stock-to-Flow Model Popular
Understanding why S2F gained such widespread adoption reveals what it does well.
Stock-to-Flow is remarkably simple. Anyone can understand “limited supply plus decreasing issuance equals higher value”. You don’t need a finance degree or deep technical knowledge. This accessibility made it viral in crypto communities.
The core premise makes intuitive sense. Scarce things tend to be valuable if people want them. Gold, rare artwork, limited edition sneakers, the pattern holds across asset classes. Applying this to Bitcoin felt natural.
From 2012 through 2020, S2F worked. Bitcoin’s price tracked the model’s predictions closely enough that it seemed predictive rather than coincidental. This track record gave the model credibility.
When a model correctly predicts multiple major price moves, people pay attention. S2F called the 2013, 2017, and 2021 rallies with reasonable accuracy. That’s hard to dismiss as luck.
S2F perfectly reinforced Bitcoin’s positioning as “digital gold.” It provided mathematical backing for the comparison. Bitcoin isn’t just metaphorically like gold, it’s quantifiably scarcer and becoming more so over time.
This narrative attracted institutional investors familiar with gold as a store of value. If Bitcoin’s S2F is higher than gold’s, the logic suggests Bitcoin could eventually capture a significant portion of gold’s market cap.
Unlike traditional markets where supply is uncertain, Bitcoin’s issuance schedule is completely transparent and predictable. Everyone knows exactly when halvings occur and how much new Bitcoin enters circulation daily.
This predictability meant S2F could make forward projections with confidence about the supply side of the equation. The only unknown was demand, which historically trended upward as Bitcoin gained adoption.
Criticisms and Limitations of the Stock-to-Flow Model
Ignores demand entirely
- S2F focuses only on supply scarcity.
- An asset can be extremely scarce but still worthless if no one wants it.
Bitcoin’s demand is not guaranteed
- Adoption could slow.
- Regulations could reduce demand.
- Better alternatives could emerge.
- S2F cannot model any of these factors.
Correlation ≠ causation
- Historical price increases may not have been caused by halvings.
- Both price and S2F may have risen due to a third factor (e.g., adoption, awareness).
Halvings may not be the true driver of price
- Critics argue Bitcoin rose because demand grew, not because issuance fell.
- Halvings simply coincided with broader bull markets.
Ignores macroeconomic realities
- Does not account for interest rates, inflation, recessions, stock market crashes, regulation, or competition.
- Treats Bitcoin as if it exists in isolation.
2022 crash exposed this flaw
- When the Fed raised rates, Bitcoin dropped with other risk assets.
- S2F provided no warning or explanation.
Criticized by major industry figures
- Vitalik Buterin called it “finance astrology,” arguing it lacks real economic grounding.
Absurd predictions at high ratios
- Extrapolating the model suggests Bitcoin should reach millions per coin, which many see as unrealistic.
Damaged credibility after major misses
- Failed to predict the 2022 crash.
- Bitcoin traded far below S2F for an extended period.
- Raises the question: How useful is a model that breaks so easily?
Does the Stock-to-Flow Model Still Hold Up?
After examining the evidence, where does S2F stand today? Scarcity still matters—Bitcoin’s fixed supply and predictable issuance remain fundamental to its value proposition, and the decreasing flow of new coins should exert upward pressure on price over time.
The 2024 halving did precede a rally to new all-time highs above $100,000, as previous halvings did, and Bitcoin’s long-term trajectory continues following an exponential growth path consistent with increasing scarcity. However, the model’s precision broke down after 2021, with Bitcoin trading below S2F predictions for years—making it unreliable for investment decisions.
Market maturation changed the game. Bitcoin is now a globally recognized asset class where macro conditions, institutional flows, and derivatives markets overwhelm simple scarcity dynamics. Alternative frameworks using realized price, MVRV ratios, and network value metrics provide more nuanced analysis than S2F’s single-variable approach.
Stock-to-Flow probably works best as a baseline framework rather than a predictive model. It correctly identifies that Bitcoin’s scarcity increases over time and supports long-term value appreciation, but treating S2F predictions as price targets leads to disappointment in modern markets with massive liquidity.
Smart investors might use S2F as a sanity check: Bitcoin at 50% below S2F during a selloff suggests ignored scarcity and potential recovery, while 200% above suggests disconnection from fundamentals.
Summing it Up
The Bitcoin Stock-to-Flow model taught the crypto world an important lesson. Scarcity matters. Bitcoin’s predictable supply schedule and decreasing issuance are fundamental to its value proposition, and the halvings do seem to catalyze bull markets historically.
But S2F also demonstrated the limitations of single-variable models. Price isn’t determined by supply alone. Demand dynamics, macro conditions, regulatory environments, and market structure all matter enormously. Ignoring these factors led to prediction failures that damaged the model’s credibility.
So where does that leave us? Stock-to-Flow works best as a long-term framework for understanding Bitcoin’s scarcity narrative, not as a precise price prediction tool. It captures an important truth (Bitcoin becomes scarcer over time), while missing crucial nuances (demand varies, markets evolve, external factors dominate).
If you’re evaluating Bitcoin as an investment, don’t rely solely on S2F. Combine it with on-chain metrics, technical analysis, macro awareness, and common sense about market cycles. Use S2F to understand the supply side of the equation, then build a complete picture by analyzing demand, sentiment, and broader market conditions.
The model isn’t completely broken, but it’s not the holy grail either. It’s one tool among many, useful for understanding Bitcoin’s fundamental scarcity while acknowledging that markets are complex systems that no single formula can fully capture.
FAQs (Frequently Asked Questions)
Q: Who created the Bitcoin Stock-to-Flow model?
A: The Stock-to-Flow model for Bitcoin was created and popularized by a pseudonymous analyst known as PlanB. He published the model in March 2019, applying the traditional commodity scarcity metric to Bitcoin’s predictable supply schedule. PlanB later refined the model with a cross-asset version that compared Bitcoin to gold and silver.
Q: Has the Bitcoin S2F model been accurate?
A: S2F was remarkably accurate from 2012 through 2020, correctly predicting Bitcoin’s general price trajectory and major bull runs following halvings. However, it overestimated Bitcoin’s price post-2021. Bitcoin peaked at $69,000 instead of the predicted $100,000 plus range, then fell well below model predictions during the 2022 bear market. Recent accuracy is mixed, the model captures long-term trends but misses short-term precision.
Q: How often does the Stock-to-Flow ratio change?
A: Bitcoin’s Stock-to-Flow ratio increases gradually every day as new blocks are mined (increasing stock) but jumps dramatically every halving. Halvings occur approximately every four years (every 210,000 blocks), cutting the flow in half overnight. The next halving is expected around 2028. Between halvings, S2F rises slowly as stock grows while flow remains constant.
Q: Does the Stock-to-Flow model apply to other cryptocurrencies?
A: Technically yes, you can calculate S2F for any cryptocurrency with known supply and issuance. However, the model works best for assets with absolutely fixed maximum supply and predictable issuance like Bitcoin. Most cryptocurrencies have variable inflation, unlimited supply, or unpredictable monetary policy changes, which makes S2F less meaningful. Litecoin is occasionally analyzed using S2F due to its halving schedule similar to Bitcoin.
Q: What are the alternatives to the S2F model?A: Several models offer more comprehensive Bitcoin valuation frameworks. The Realized Price (average cost basis of all coins) and MVRV ratio (market cap divided by realized cap) incorporate on-chain data. NVT ratio (network value to transactions) measures value relative to utility. Most serious analysts now use combinations of these metrics rather than relying on S2F alone.
Disclaimer
This article is for educational and information purposes, and should not be considered financial advice. For more information visit our disclaimer page
About the Author