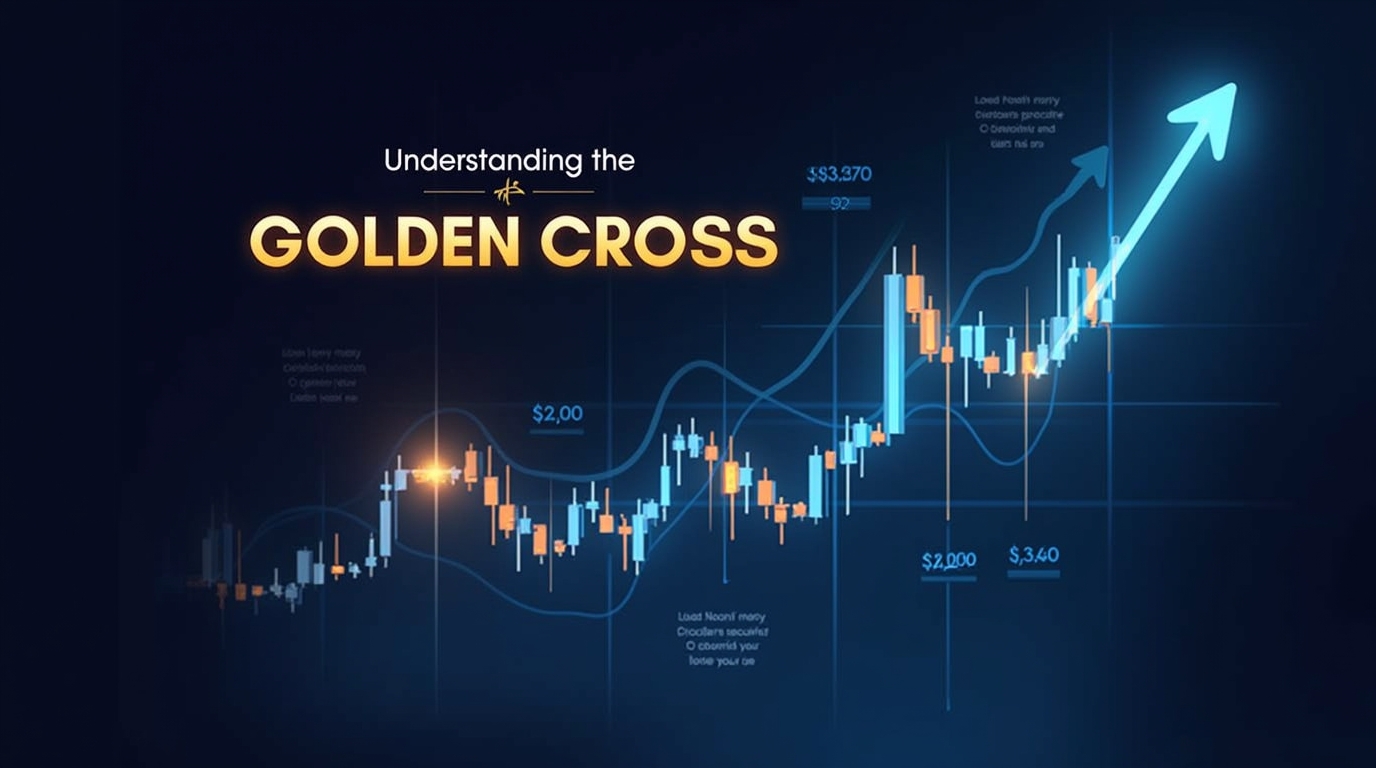
Can you imagine seeing a chart signal that has historically preceded sustained market rallies and is supported by above-average profits? Take this as the S&P 500’s Golden Cross pattern in the traditional markets is formed when the 50-day moving average crosses above the 200-day MA, has led to higher index levels over 70 percent of the time in the year following its appearance. In many instances, this strategy has also delivered stronger risk-adjusted returns than a simple buy-and-hold approach.
This is the Golden Cross signal, which is most commonly used in bullish trading patterns. It serves as a visual representation of shifting momentum, as shorter-term price trends overtake longer-term trends, and may provide an early indication that market sentiment is turning positive. The Golden Cross serves as a statistically relevant signal of emerging trends and trade opportunities in crypto and traditional markets.
What Is a Golden Cross Pattern in Trading?
A Golden Cross is a bullish chart event that occurs when a short-term moving average crosses above a long-term moving average on a price chart. This signals that recent price momentum is strengthening relative to the broader trend and is commonly interpreted as the potential start of an upward move.
Recent trading shows that the Golden Cross occurs when the 50-period moving average crosses above the 200-period moving average. The short-term average shows recent price action, while the long-term average reflects the prevailing market trend. When the faster-moving average crosses above the slower one, it indicates that buying pressure has increased enough to shift the overall market direction.
Considering the chart perspective, traders observe the given three elements:
- Price stabilizing or rising after a downtrend or consolidation phase.
- Short-term moving average turning upward.
- The crossover point is when the short-term average crosses above the long-term average.
The crossover does not predict price movement on its own. Still, it serves as a trend-confirmation signal, helping traders identify when the market may be transitioning from bearish to bullish conditions.
Why Golden Cross Matters in Crypto Trading
Crypto traders rely on the Golden Cross because it provides a clear, structured way to identify shifts in market momentum in the highly volatile crypto environment. With crypto markets trading continuously, sentiment changes rapidly, making technical confirmation tools valuable. The Golden Cross is valuable across major crypto assets because it is associated with market optimism and is a simple trend-confirmation signal.
In crypto markets, the Golden Cross pattern has appeared during transitions from extended bearish or consolidation phases into sustained upward trends. Because it is based on moving averages rather than short-term price fluctuations, it helps traders filter out noise and focus on broader directional strength. Its straightforward visual structure makes it easy to implement manually or integrate into automated trading systems, dashboards, and alerts.
As a Bullish Signal
The Golden Cross occurs when a short-term moving average crosses above a long-term moving average on a price chart. Technically, this crossover indicates that recent price action is gaining strength relative to the longer-term trend. In crypto trading, this fluctuation is interpreted as growing buying pressure and improving market sentiment.
The Golden Cross is commonly used as a bullish confirmation signal rather than a predictive signal. Traders see this as evidence that momentum is tilting upward, which is why it is frequently used as an entry trigger for long positions or as confirmation to hold existing positions with greater confidence.
A Sign of Trend Reversal
Beyond signalling momentum, the Golden Cross is known as a potential indicator of trend reversal. In most cases, it forms after a prolonged downtrend or an extended period of sideways price movement. During this time, the long-term moving average remains above the short-term average, reflecting sustained bearish or weak conditions.
Once the selling pressure fades and the price begins to recover, the short-term moving average rises and eventually crosses above the long-term average. This transition suggests that bearish momentum may be ending and that a new uptrend could be developing. This provides an opportunity to reposition early in crypto trades ahead of a potential trend shift, rather than reacting late once prices have moved higher.
A Technical Trigger for Trade Entries and Exits
Traders use the Golden Cross as a technical trigger rather than a standalone decision-making tool. The crossover point serves as a reference for planning entries, exits, or re-entries when combined with other confirming signals.
Common supporting factors include increased trading volume around the crossover, higher price highs, and alignment of momentum indicators such as RSI and MACD. Some traders enter positions shortly after the crossover, while others wait for additional confirmation. The same structure can also help traders manage exits, either by scaling out as momentum weakens or preparing for a reversal if the short-term average turns back below the long-term trend.
The Three Stages of a Golden Cross Explained
The Golden Cross doesn’t suddenly appear on the chart; it’s a sequential process that reflects how market sentiment shifts from bearish to bullish over time. Understanding the three stages of this phenomenon helps traders visually recognize the pattern early and avoid reacting late or emotionally.
- Bottoming Out Phase
The first stage follows a prolonged downtrend or an extended consolidation period. During this time, the price action begins to stabilize, selling pressure weakens, and downside momentum slows.
On the chart, the long-term moving average remains above the short-term moving average, indicating a bearish or neutral market structure. However, the short-term moving average flattens and gradually begins turning upward as recent prices improve.
This tage looks like price forming a base, with lower lows no longer expanding aggressively. This phase suggests that bearish control may be fading, though the trend has not yet been confirmed.
- The Crossover Event
The next stage involves defining the Golden Cross. It occurs when the short-term MA crosses above the long-term MA. This crossover shows that the recent price momentum has become stronger than the longer-term trend.
On the chart, this appears as a faster-moving average line that intersects and crosses above the slower one. Traders often watch this level closely, as it marks a technical shift from bearish dominance to emerging bullish strength.
While this event generates the Golden Cross signal, experienced traders treat it as an alert rather than an immediate confirmation, since the moving averages lag and false crossovers can occur in choppy markets.
- Confirmation of a New Uptrend
The last and final stage focuses on validation. Once the crossover completes, the price moves higher, and the short-term MA stays above the long-term MA. Both moving averages move upward, confirming sustained bullish momentum.
This phase is indicated on the chart by higher highs, higher lows, and an expanding spread between the two moving averages. Rising trading volume during this phase further strengthens the signal, indicating active buyer participation.
This is the stage at which many traders gain confidence in the trend and look for structured long entries, pullbacks, or continuation setups, rather than reacting impulsively at the crossover point.
Key Signals That Confirm a Golden Cross Pattern
The Golden Cross becomes actionable when additional technical confirmation signals support it. As the moving averages are lagging indicators, confirmation from additional technical and market signals is important to reduce the risk of false breakouts. The following signals are used to validate whether a Golden Cross represents a genuine shift in trend instead of a temporary deviation.
The Moving Average Crossover
A strong Golden Cross occurs when the short-term moving average decisively crosses above the long-term moving average and remains above it for several sessions. A brief cross followed by an immediate reversal often signals indecision instead of a confirmed trend change. Steady separation between the two averages after the crossover suggests sustained bullish momentum instead of short-lived price fluctuation.
Rising and Sustained Trading Volume
Increasing trading volume around or shortly after the crossover is one of the most important validation signals. Higher volume represents broader market participation and stronger conviction behind the price move. A Golden Cross formed on declining or weak volume is likely to fail, as it suggests the move is driven by limited buying interest. Consistent volume expansion following the crossover reinforces the probability that the trend shift has market support.
Broader Market and Trend Momentum
The phenomenon is reliable when it aligns with overall market momentum. The confirmation is stronger when broader conditions are supportive, such as a bullish Bitcoin trend, rising market capitalization, or sector-wide strength across major assets. A Golden Cross forming against a strongly bearish market backdrop is likely to fail as larger market forces often override individual technical signals.
Moreover, when price action is making higher highs and higher lows before or shortly after the crossover, it supports the idea that bullish momentum is developing beneath the surface.
RSI Confirmation
The RSI is commonly used to assess momentum during a Golden Cross setup. A confirming signal occurs when RSI is trending upward and holding above neutral levels. This shows that bullish momentum is strengthening without the market being excessively overbought. If the RSI is flat or declining when the Golden Cross forms, it suggests weak momentum and a higher risk of a false signal.
MACD Alignment
The MACD indicator is another widely used confirmation tool. A Golden Cross gains reliability when the MACD line moves above the signal line, and both are trending upward or near the crossover point. This alignment indicates accelerating bullish momentum across multiple timeframes. A flattening MACD during a Golden Cross indicates that upward momentum is weak.
Avoiding False Breakouts Through Confidence
The most reliable Golden Cross setup occurs when multiple confirmations align simultaneously. A strong crossover, rising volume, supportive market conditions, and positive momentum indicators create a confluence. This layered confirmation helps traders avoid false breakouts in range-bound or highly volatile crypto markets.
How to Spot a Golden Cross on Crypto Charts
To detect Golden Cross on a cryptocurrency requires using charting tools like TradingView and the following steps:
- Open the chart for the chosen asset and set an appropriate timeframe, a daily chart for swing or long-term trading. Note that the daily timeframe smooths out intraday noise and gives a clearer trend signal. Many traders also examine weekly charts to gauge broader trends.
- Add two moving-average indicators to the chart. A shorter-term MA reflects more recent price action, and a longer-term MA captures the broader, underlying trend.
- Observe the relationship between the two MAs over time. When the shorter-term MA is below the longer-term MA, the market is either bearish or neutral. When the price action shifts, the 50-period MA may begin to rise, narrowing the gap between the MAs.
- Watch for the crossover point when the 50-period MA crosses above the 200-period MA; this crossover is the Golden Cross.
- After the crossover, check whether the price continues upward and whether supporting signals appear. This helps avoid acting on a false breakout.
Golden Cross Pattern Examples
Bitcoin Golden Cross – February 7, 2023
On February 7, 2023, Bitcoin’s 50-day MA crossed above its 200-day MA, causing a Golden Cross signal. The price after the crossover was roughly around US$18,994, and Bitcoin rallied significantly over subsequent months, validating the bullish signal for many traders.
Bitcoin Golden Cross – October 2020
According to the weekly chart, a Golden Cross formed for Bitcoin around October 2020, when a shorter-term moving average crossed above the longer-term weekly moving average. This overcame a major bull run that ultimately drove Bitcoin from US$10,000 to its then all-time highs.
Ethereum Golden Cross – February 2020
On February 2, 2020, Ethereum formed a Golden Cross when the 50-day MA crossed above the 200-day MA at approximately US$180. Over the next two months, ETH experienced a substantial price increase, showing that this pattern can appear beyond Bitcoin and still deliver significant upside when broader conditions align.
Putting the Golden Cross Into Practice: Trading Strategies That Work
Using the Golden Cross requires more than spotting a moving-average crossover. Traders who apply it effectively define clear moving-average settings, align the signal with the broader market structure, and apply disciplined entry, exit, and risk rules. When combined with volume analysis and supporting indicators, the Golden Cross becomes a practical trend-following structure rather than a standalone trigger.
Choosing the Right Moving Averages and Timeframes
The 50-period moving average crossing above the 200-period moving average is the most widely used Golden Cross configuration. This configuration is applied to daily charts and is best suited for swing traders and long-term participants who want to capture sustained trends rather than short-term price fluctuations. It smooths out volatility and reduces noise, which is particularly useful in highly volatile crypto markets.
For shorter-term or intraday trading, some traders use faster moving averages, such as 20/100 or 20/50, on lower timeframes, such as 1- or 4-hour charts. These faster combinations respond more quickly to price fluctuations and can generate earlier signals, but they also increase the likelihood of false crossovers. Choosing the right moving averages and timeframes depends on the trader’s objectives, holding period, and tolerance for drawdowns.
Confirming the Signal with Volume, Trend & Market Context
A Golden Cross is more reliable when it forms alongside confirming market conditions. Rising or expanding trading volume near the crossover suggests that the upward move is supported by active participation rather than thin or temporary buying interest. Without volume confirmation, crossovers are more susceptible to failure, especially in ranging markets.
Traders also assess the broader trend and market environment. A Golden Cross that forms while the overall market is already trending upward typically carries more weight than one that appears against a strong bearish backdrop. Momentum indicators like RSI can further validate the signal by showing strengthening buying pressure rather than overbought exhaustion at the time of the crossover.
Entry and Exit Rules for Different Trading Styles
Once the Golden Cross forms, traders wait for confirmation before committing capital. Swing traders enter the crossover after it is followed by higher closes or a brief pullback that holds above the long-term moving average. Long-term traders may enter the position once the trend structure is established, rather than attempting to time the exact crossover point.
Exit rules should be defined in advance. Some traders take partial profits as the price moves further from the moving averages, while others hold until a bearish crossover begins to form. Invalidation levels are equally important: a decisive move back below the long-term moving average, or failing to maintain higher lows, can signal that the Golden Cross has lost validity.
Using Support, Resistance & Breakout Levels for Better Timing
Support and resistance analysis adds structure to Golden Cross strategies. When a Golden Cross occurs in a well-defined support zone, the signal often carries greater weight because downside risk is clearly defined. Likewise, a crossover coinciding with a breakout above a major resistance level suggests that the market has absorbed selling pressure and is entering a new phase of price discovery.
Many traders improve their timing by waiting for a breakout or a successful retest of former resistance that has turned into support after the Golden Cross forms. This confluence of trend signal and market structure helps filter weaker setups and improves overall trade quality by aligning momentum with price behavior.
Combining the Golden Cross with Other Indicators
The Golden Cross becomes more effective when paired with complementary indicators. RSI confirms that momentum is shifting upward without yet reaching overbought conditions. MACD alignment, where the MACD line crosses above its signal line, the Golden Cross, to force the idea that momentum is building across multiple measures.
Trend-strength tools such as ADX help determine whether the emerging trend is strong enough to justify entry, while volume indicators confirm participation. Using these tools together helps traders avoid taking Golden Cross signals that occur in low-momentum or sideways conditions, where moving-average crossovers tend to fail.
Backtesting the Golden Cross Before Trading It Live
Before applying the Golden Cross strategy in live markets, backtesting is critical. Testing different moving-average combinations and timeframes on historical data reveals how a specific setup would have performed across various market conditions. This process helps identify which configurations produce consistent results and which generate excessive false signals.
Backtesting also allows traders to refine entry timing, profit targets, stop-loss placement, and position sizing. By understanding the historical behavior of the Golden Cross in a given market, traders gain confidence in their strategy and reduce emotional decision-making when executing trades in real time.
Golden Cross Versus Death Cross: The Key Differences
The Golden Cross and Death Cross are the foundational moving-average crossover patterns in technical analysis that signal different market conditions based on the relationship between a shorter-term moving average and a longer-term moving. In a Golden Cross, the short-term MA crosses above the long-term MA, indicating that recent price momentum has strengthened relative to the longer-term trend. Conversely, a Death Cross occurs when the short-term MA crosses below the long-term MA, indicating that recent price momentum has weakened relative to the long-term trend and suggesting a bullish trend shift with potential upward continuation. Alternatively, the Death Cross occurs when the short-term MA moves below the long-term MA, showing that the recent price momentum has weakened relative to the long-term trend, a setup interpreted as a bearish trend shift with potential downward continuation. Both patterns rely on the same MA strategies but signal opposite directional implications for price action.
Traders respond differently to these patterns, and a Golden Cross can prompt bullish positioning, such as initiating long trades, adding to existing long exposure, or reducing short exposure once the crossover is confirmed, particularly when supported by higher trading volume or corroborating indicators. The Death Cross is treated as a bearish signal, prompting defensive or risk-reducing actions such as closing long positions, initiating shorts, or hedging exposure as the short-term momentum declines relative to the long-term trend. Both signals are considered lagging indicators that confirm a trend that has already begun, rather than predicting future price moves.
Both patterns are mirror images on a chart: the Golden Cross is indicated by a shorter MA line crossing above and rising above the longer MA line, whereas the Death Cross is indicated by a shorter MA line crossing below and declining below the longer MA line. Recognizing the direction of the crossover and broader price context helps traders distinguish between potential bullish and bearish trend startings.
| Feature | Golden Cross | Death Cross |
| Type of Signal | Bullish trend reversal | Bearish trend reversal |
| Crossover Mechanism | Short-term MA crossing above long-term MA | Short-term MA crossing below long-term MA |
| Market Implication | Suggests rising momentum and potential upward price movement | Suggests weakening momentum and potential downward price movement |
| Trader Response | Consider entering or adding to long positions, reducing short exposure | Consider exiting long positions, initiating shorts, or hedging risk |
| Confirmation Characteristics | Often stronger if paired with rising volume and supportive indicators | Often stronger if confirmed by increased selling volume and bearish context |
| Indicator Nature | Lagging as it confirms trend shift | Lagging as it confirms trend shift |
Pros and Cons of Trading the Golden Cross Pattern
The Golden Cross pattern is known as a bullish signal in technical analysis, identified when a shorter-term MA crosses above a longer-term MA. This crossover suggests that the recent price trend has gained sustained strength relative to the longer trend, and it’s often interpreted as an early sign of bullish market momentum. Its simplicity and broad applicability make it easy to visualize the crossover on the chart without complex calculations, and it can be applied across asset classes, including equities, forex, commodities, and cryptocurrencies. The pattern has proven useful in trend-identification strategies and serves as an accessible entry and exit marker for traders with varying time horizons. Moreover, when combined with technical indicators such as RSI or MACD, the Golden Cross supports more transparent decision-making frameworks that align with broader trend confirmation.
Despite the advantages, the Golden Cross has notable limitations that traders must understand before integrating it into live strategies. It becomes a lagging indicator, signalling after a trend has already begun. This delay reduces the relative profit potential or results in entries that occur in a move in the crypto environment. The pattern protects against false signals, or “whipsaws,” in choppy markets, where moving averages may cross repeatedly without a sustained trend, creating multiple misleading entry points. Lastly, because the Golden Cross is purely technical, it doesn’t account for fundamental market drivers, macroeconomic catalysts, or sudden shifts in sentiment, making it less reliable in isolation. Traders can avoid these drawbacks by requiring confirmation from additional indicators and market context before acting.
| Pros | Cons |
| Easy to identify and interpret on price charts, and is suitable for traders of all levels. | Signals often occur after the trend has already begun, reducing profit potential. |
| It has been observed preceding major uptrends across multiple asset classes and timeframes. | Frequent crossovers can produce misleading signals in choppy markets. |
| It helps confirm a shift from bearish to bullish sentiment when volume or other indicators support it. | Best used with additional technical tools to avoid acting on weak signals. |
| It can be applied on stocks, crypto, forex, commodities, and indices on various timeframes. | Does not account for external market news or economic conditions that can drive price fluctuations. |
Mistakes to Avoid When Trading the Golden Cross
Depending on the Golden Cross, using bullish indicators without proper context or confirmation can lead to poor trading decisions. Below are common mistakes when using the Golden Cross, along with practical guidance to avoid them.
Blindly Trusting the Pattern in Isolation
Treating the Golden Cross as a standalone buy signal is a frequent mistake. The crossover is a lagging indicator, meaning it reflects price action that has already occurred. Entering trades alone because the short-term MA crossed above the long-term MA can result in late entries, especially if the price has moved significantly.
To avoid this, always pair the Golden Cross with additional confirmation tools, such as volume trends, momentum indicators, or broader trend analysis, to ensure the price has moved significantly.
Ignoring Overall Market Context
Golden Cross signals are reliable in trending markets and far less effective during highly volatile conditions. Still, sudden events, macroeconomic shifts, or broader market sell-offs can completely override technical patterns.
To avoid this situation, assess the broader market environment before acting. If the overall market is bearish, risk-off, or range-bound, the Golden Cross may fail to follow through on a single asset.
Following Signals Too Late
Traders wait for a highly visible Golden Cross on higher timeframes and then enter aggressively, often after a large portion of the rally has occurred. This increases downside risk and reduces reward potential.
So, instead of chasing price, wait for follow-through confirmation, such as pullbacks, consolidation above key support levels, or a retest of the MA after the crossover.
Overlooking Volume Confirmation
A Golden Cross that forms without trading volume lacks conviction, and low volume indicates weak participation, increasing the likelihood of a false breakout or a short-lived move.
To avoid this mistake, look for rising or above-average volume during or shortly after the crossover. Strong volume supports the idea that buyers are actively driving the trend change.
Using inappropriate Timeframes or MA
Applying long-term MAs to short-term trades or short-term MAs to long-term investments leads to mismatched signals and inconsistent results. To fix this, MA settings and timeframes to your trading style. Longer MA periods are ideal for swing and position trading, while shorter MA periods may be used for intraday setups.
Summing It Up
The Golden Cross pattern remains one of the most effective technical signals, serving as a visual and statistical indication that momentum may be trending upward. When the pattern is viewed alongside volume trends and the broader market context, it can help traders and investors filter noise and identify meaningful trend changes that align with their strategic objectives and risk tolerance. Even if you’re analyzing a cryptocurrency, understanding how the pattern develops and confirming it with additional indicators can sharpen your timing and decision-making.
To stay ahead of the changing crypto environment, it’s important to stay informed with timely insights. Dypto Crypto delivers clear, concise educational content, trending market developments, and practical guidance straight to your inbox with a newsletter, helping learns decode complex trends and apply them with confidence. Subscribing ensures you receive curated updates all designed to support smarter trading and broader crypto literacy.
Sign up for Dypto Crypto and subscribe to its newsletter for weekly updates, latest news, and expert insights that help beginners trade with clarity and stay informed as the market shifts.
Frequently Asked Questions
How reliable is the golden cross in crypto markets?
It can be a strong signal, especially when confirmed by volume and supported by broader trend context, but it is not foolproof. In volatile or range-bound markets, false signals can occur.
Which moving averages work best for spotting a golden cross?
The most widely used pair is the 50-day (short-term) and 200-day (long-term) MA. For shorter-term or more aggressive strategies, combinations like 20/100 or even shorter (on crypto) may be used, though with increased risk of noise.
Does a golden cross guarantee a price increase?
No. It indicates that recent momentum has shifted to the upside, but it does not guarantee a sustained rally. Other market factors and confirmation signals must be considered.
What timeframe is best for identifying a golden cross?
The daily and weekly charts are considered the best and most reliable timeframes for identifying a golden cross, especially for swing traders and long-term investors.
Disclaimer
This article is for educational and information purposes, and should not be considered financial advice. For more information visit our disclaimer page
About the Author