
In the fast‑moving world of crypto trading, spotting a reversal before it happens can mean the difference between protecting profits and watching them vanish. One of the most telling signals of trend exhaustion is the Triple Top Pattern, a formation that quietly warns traders the bullish run may be over. This pattern emerges when price rallies three times to the same resistance level but fails to break through, revealing that buyers are losing strength and sellers are ready to take control. Once the neckline support gives way, the market often shifts sharply downward.
Recognizing this setup isn’t just about technical analysis; it is about safeguarding your capital in volatile markets where reversals can wipe out gains in a matter of hours. By learning to identify the triple top early with our detailed blog, you will gain a powerful tool to anticipate bearish turns and avoid costly mistakes.
What is the Triple Top Pattern?
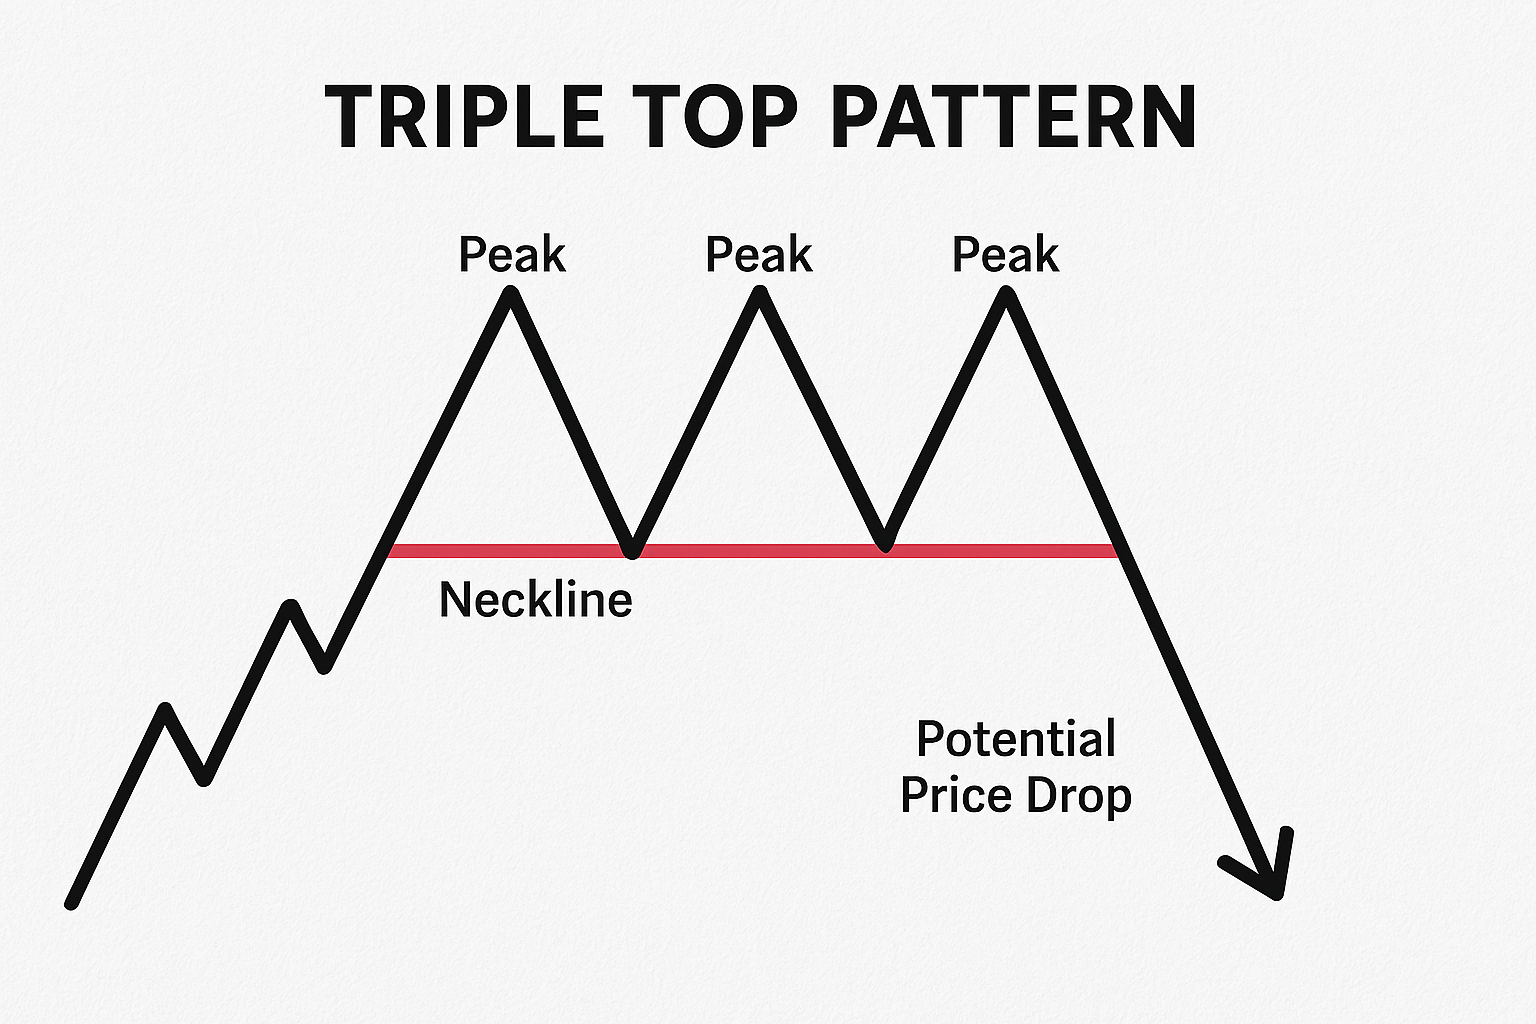
The Triple Top Pattern is a bearish reversal chart formation that signals the end of an uptrend. It consists of three peaks at roughly the same price level, followed by a breakdown below a support line (the neckline), which often triggers a sharp price decline.
It is a technical analysis formation that occurs after a sustained uptrend. It represents trend exhaustion, in which buyers fail to push prices higher despite multiple attempts. Once the support (neckline) is broken, it confirms a shift from bullish to bearish sentiment.
The triple top pattern forms when an asset rallies three times to a similar resistance level, creating three distinct peaks. Between each peak, the price pulls back slightly, forming two troughs that define a horizontal support line known as the neckline. This structure reflects repeated failed attempts by buyers to push the price higher, signaling weakening bullish momentum. Once the price breaks below the neckline after the third peak, it signals a bearish reversal and often leads to a significant decline as sellers gain control.
- The pattern suggests that buyers are losing strength and sellers are gaining control.
- A confirmed breakout below the neckline often leads to a significant price drop.
- Traders typically use this pattern to exit long positions or enter short trades.
- Studies show that about 88% of triple top patterns lead to reversals, making it a reliable indicator.
How Does a Triple Top Pattern Signal a Reversal
The triple top pattern signals a reversal by highlighting the market’s inability to sustain its upward momentum. It begins during an established uptrend, where buyers consistently push prices higher. However, as the pattern develops, the price fails to break through a key resistance level despite multiple attempts. This repeated failure reflects weakening bullish sentiment and growing selling pressure.
The critical moment comes when the price breaks below the neckline, a support level formed by the troughs between the peaks. This breakdown confirms the bearish reversal, indicating that sellers have taken control and that a downward move is likely. Traders often interpret this as a strong signal to exit long positions or initiate short trades, as the market has shifted from strength to weakness.
The Uptrend Leading to Formation
Before a triple top pattern can form, there must be a clear and sustained uptrend. This prior uptrend is essential because it sets the stage for the potential reversal signal. In an uptrend, buyers dominate the market, driving prices higher through consistent demand and optimism. As prices rise, traders and investors expect the bullish momentum to continue, often reinforcing the trend with additional buying.
However, this upward movement eventually encounters a resistance level, a price point where selling pressure begins to match or exceed buying interest. The triple top pattern forms when the market repeatedly tests this resistance but fails to break through it. Without the preceding uptrend, the triple top would not carry the same significance, as it marks the exhaustion of bullish momentum and the transition toward bearish control. Thus, the prior uptrend provides the foundation for the triple top as a reliable reversal indicator.
The Three Peaks and Resistance Level
The defining feature of the triple top pattern is the formation of three distinct peaks at approximately the same resistance level. Each peak represents an attempt by buyers to push the price higher, but each time, the market stalls and reverses downward. This repeated failure to break resistance is a clear sign of weakening buying pressure. Initially, the first peak may be dismissed as a temporary pause, but as the second and third peaks form, the pattern becomes more evident.
The inability to surpass resistance demonstrates that bullish momentum is fading, while bearish sentiment is gradually strengthening. Sellers become more confident that the price cannot move higher, and buyers lose conviction in the uptrend. This tug-of-war between buyers and sellers ultimately tilts in favor of the bears, as the resistance level proves too strong to overcome. The three peaks represent market exhaustion, signaling an imminent reversal.
Neckline Breakdown and Confirmation
The neckline is the horizontal support line drawn across the troughs between the three peaks and is crucial in confirming the triple top pattern. As long as the price remains above the neckline, buyers still have a chance to regain control. However, once the price breaks below this support level, it signals a decisive shift in market sentiment. The breakdown below the neckline confirms that sellers have overwhelmed buyers, and the uptrend has officially reversed into a bearish phase.
This confirmation is critical because it transforms the triple top from a potential reversal into a validated signal. Traders often use this breakdown as an entry point for short positions, anticipating further declines. The strength of the reversal is often reinforced by increased trading volume during the breakdown, which shows strong conviction among sellers. In essence, the neckline serves as the final barrier; once breached, it confirms a triple top and signals a significant downward move.
Triple Top vs. Triple Bottom
The Triple Top and Triple Bottom are opposite chart patterns in technical analysis, each signaling a reversal in market direction. Recognizing the difference between them helps traders anticipate shifts in sentiment and adjust their strategies accordingly.
| Pattern | Market Context | Structure | Signal | Crypto Example |
| Triple Top | After uptrend | 3 peaks at resistance, neckline support | Bearish reversal | BTC failing at $70k, breaking $65k |
| Triple Bottom | After downtrend | 3 troughs at support, neckline resistance | Bullish reversal | ETH holding $1.5k, breaking $1.7k |
Triple Top: Bearish Reversal
A Triple Top forms after a strong uptrend when the price tests the same resistance level three times but fails to break through. This repeated failure indicates weakening buying pressure and growing bearish sentiment. Once the price breaks below the neckline (support line drawn across the troughs), the pattern confirms a bearish reversal.
Imagine Bitcoin (BTC) rallying to $70,000 three times over several weeks. Each attempt stalls at that resistance level, and after the third peak, BTC drops below $65,000 (the neckline). This breakdown signals that sellers have taken control, and traders anticipate a deeper decline, perhaps toward $60,000 or lower.
Triple Bottom: Bullish Reversal
A Triple Bottom is the mirror opposite. It forms after a prolonged downtrend, when the price tests the same support level three times but fails to break below it. This repeated defense of support shows that selling pressure is weakening while buying pressure is strengthening. Once the price breaks above the neckline (resistance line drawn across the peaks between troughs), the pattern confirms a bullish reversal.
Suppose Ethereum (ETH) falls to $1,500 three times during a bearish phase. Each time, buyers step in to defend that level, preventing further decline. After the third trough, ETH rallies and breaks above $1,700 (the neckline). This breakout signals renewed bullish momentum, and traders expect ETH to climb toward $1,900 or higher.
How to Spot a Triple Top Pattern on the Chart
Identifying a true triple top pattern on a crypto chart requires careful observation of price action and supporting indicators. Traders should look for three distinct peaks forming at nearly the same resistance level, each separated by moderate declines. This repeated failure to break higher signals weakens bullish momentum. Between the peaks, the troughs create a horizontal support line known as the neckline, which becomes the critical level to watch.
A genuine triple top is confirmed when the price breaks below the neckline after the third peak. Volume plays an important role here: during peak formation, trading volume often decreases, indicating reduced buying interest. When the neckline is broken, volume typically spikes, reflecting strong selling pressure and confirming the bearish reversal.
To summarize, spotting a triple top involves:
- Consistent peak levels: Three highs at similar resistance.
- Volume changes: Declining volume during peaks, rising volume on breakdown.
- Neckline support: A clear horizontal line that, once broken, validates the reversal.
In crypto markets, this pattern often appears after strong rallies in assets like Bitcoin or Ethereum, warning traders that the uptrend may be exhausted and a bearish phase is likely to follow.
Trading the Triple Top Pattern in Crypto Markets
Trading a confirmed triple top pattern in crypto markets requires discipline, patience, and a clear plan from entry to exit. The pattern itself signals a bearish reversal after an uptrend, but traders should avoid acting prematurely. Instead, you should wait for confirmation of the breakdown below the neckline before entering positions. Once confirmed, traders can initiate short trades or exit long positions, using risk management strategies to protect capital.
The process involves identifying reliable entry triggers, setting stop losses to limit potential losses, and calculating profit targets based on the expected downside move. By combining technical signals with disciplined execution, traders can use the triple top pattern as a structured framework for navigating bearish reversals in volatile crypto markets.
Entry Triggers & Confirmation Techniques
The most common entry trigger for a triple top trade is the confirmed breakdown below the neckline, ideally accompanied by rising volume. This surge in volume demonstrates strong selling pressure and validates the bearish reversal.
Traders often wait for a daily or 4-hour candle to close below the neckline rather than reacting to intraday moves, as false breakdowns are common in crypto markets. Patience is critical here, as jumping in too early can lead to whipsaws if the price rebounds above the neckline.
Some traders also use confirmation techniques, such as monitoring momentum indicators (e.g., RSI or MACD), to ensure that bearish signals align with the chart pattern. By combining price action with volume and indicator signals, traders increase the reliability of their entry and reduce the risk of being caught in a failed breakout.
Stop-Loss Strategy & Smart Risk Management
A disciplined stop-loss strategy is essential when trading the triple top pattern. The most common placement is slightly above the third peak, as this level represents the invalidation point of the bearish setup.
Alternatively, traders may place a stop just above the neckline if they anticipate a possible retest after the breakdown. Position sizing should be carefully calculated to ensure that even if the stop-loss is triggered, the loss remains manageable relative to account size. Over-leverage is particularly dangerous in crypto markets, where volatility can quickly erase gains.
By combining conservative position sizing with strict stop-loss placement, traders protect themselves from unexpected reversals and maintain long-term consistency. Risk management is not just about avoiding losses; it is about ensuring that one losing trade does not compromise the ability to trade future opportunities.
Profit Targets & Measuring the Expected Downside Move
Profit targets in a triple top trade are typically measured by calculating the vertical distance between the peaks and the neckline. This height is then projected downward from the neckline to estimate the expected downside move.
For example, if the peaks are $2,000 above the neckline, traders anticipate a decline of roughly $2,000 below the neckline once the breakdown occurs. This measured move provides a logical target, but traders often use trailing stops to lock in profits as the move progresses.
Trailing stops allow traders to capture extended declines while protecting gains if the market rebounds. In crypto markets, where sharp moves are common, combining measured targets with dynamic trailing stops ensures traders maximize potential profits while maintaining flexibility. This approach balances precision with adaptability, helping traders capitalize on bearish reversals without being overly rigid in their exit strategy.
Making Triple Tops Part of a Larger Trading Strategy
The triple top pattern is a powerful signal of bearish reversal, but it should never be used in isolation. In crypto markets, where volatility, sentiment, and macroeconomic factors often drive price action, this pattern is most effective when integrated into a broader trading strategy that incorporates multiple layers of analysis and risk controls.
- Macro Analysis: A triple top highlights market exhaustion after an uptrend. Still, traders gain more confidence when they combine it with macro analysis, such as monitoring global liquidity trends, regulatory developments, or Bitcoin’s correlation with traditional assets like equities or gold. For example, if a triple top forms on Ethereum while broader risk assets are also showing weakness, the signal carries more weight.
- Sentiment Analysis: Sentiment analysis is equally important. Social media narratives, funding rates, and trader positioning heavily influence crypto markets. If a triple top coincides with declining sentiment, such as falling open interest or bearish chatter on X (formerly Twitter), it strengthens the case for a reversal.
- Portfolio-Level Risk Control: Portfolio-level risk controls ensure that no single trade jeopardizes overall capital. Traders should size positions conservatively, diversify across assets, and avoid over-leverage. Using the triple top as a tactical entry point within a disciplined portfolio strategy allows traders to capture downside opportunities while maintaining resilience against unexpected market swings.
In short, the triple top pattern is most effective when viewed as part of the puzzle. A technical signal that gains reliability when aligned with macro context, sentiment trends, and robust portfolio-level risk management.
Summing Things Up
The triple top pattern is a classic bearish reversal signal that appears after a strong uptrend. It forms when the price tests the same resistance level three times, creating three distinct peaks, but fails to break higher. Between these peaks, troughs establish a horizontal support line known as the neckline. The pattern is confirmed once the price breaks below this neckline, often accompanied by rising volume, which signals that sellers have taken control and a downward move is likely.
To identify a true triple top, traders should look for:
- Three peaks at nearly the same resistance level.
- Declining volume during the peaks, showing weakening buying pressure.
- A clear neckline formed by the troughs.
- A decisive breakdown below the neckline with increased selling volume.
To trade the triple top effectively, discipline is key. Traders typically wait for confirmation, such as a close below the neckline, before entering short positions or exiting longs. Stop losses are best placed slightly above the third peak or just above the neckline to protect against false breakouts. Profit targets are calculated by measuring the distance between the peaks and the neckline, then projecting it downward from the neckline. Trailing stops can also be used to lock in profits as the move progresses.
Above all, in volatile crypto markets, the triple top should be traded with confirmation and risk management as top priorities. Acting too early or ignoring protective measures can lead to costly mistakes, while a disciplined approach ensures traders capitalize on bearish reversals without incurring unnecessary risk.
Frequently Asked Questions
Does the triple top pattern work equally well in low‑liquidity altcoins as it does in major coins?
The triple top pattern is less reliable in low‑liquidity altcoins because thin trading often leads to erratic price movements and false breakouts. In contrast, major coins like Bitcoin or Ethereum have deeper liquidity, making chart patterns more consistent and trustworthy. Traders should always seek confirmation with volume and avoid relying solely on the pattern in illiquid markets.
What timeframe gives the most reliable triple top pattern in crypto markets?
The triple top pattern is most reliable on higher timeframes such as the 4‑hour, daily, or weekly charts. These longer intervals filter out market noise and reduce the risk of false breakouts common in lower timeframes. In volatile crypto markets, waiting for a daily close below the neckline provides stronger confirmation of a bearish reversal.
How to integrate a triple top trade into portfolio risk management in crypto?
To integrate a triple top trade into portfolio risk management, treat it as one tactical position within a diversified strategy. Use conservative position sizing and avoid over‑leverage to limit exposure. Always set stop‑losses above key resistance levels and align the trade with overall portfolio goals, ensuring no single reversal jeopardizes long‑term capital.
Disclaimer
This article is for educational and information purposes, and should not be considered financial advice. For more information visit our disclaimer page
About the Author