Candlestick patterns are more than just chart visuals; they are windows into market psychology. In crypto trading, where volatility and momentum shifts happen in seconds, these patterns help traders interpret crowd behavior and anticipate potential moves. They condense complex buying and selling dynamics into simple, recognizable structures that anyone can learn to read.
Among the many candlestick formations, the Three Line Strike stands out for its dramatic appearance and the strong message it conveys about market sentiment. It is not just another pattern; it signals decisive action, whether in the form of continuation or reversal, depending on the context. Traders value it because it combines clarity with impact: three candles moving in one direction, followed by a powerful strike candle that engulfs them all.
In this article, we will break down how to identify the Three Line Strike on crypto charts, explain how to trade it effectively with clear rules and risk management techniques, and share best practices to avoid common mistakes. Whether you are new to candlestick analysis or looking to refine your approach, this article will give you a structured, beginner-friendly roadmap for using the Three Line Strike in real-world crypto trading.
What Is the Three Line Strike Candlestick Pattern?

The Three Line Strike is a four-candle candlestick pattern that appears on price charts and is often used in technical analysis to interpret market sentiment. It is considered a continuation pattern, though its structure can sometimes suggest a reversal, depending on the context.
Structure & Formation
First Three Candles
- Move consistently in the same direction (either bullish or bearish).
- They reinforce the prevailing trend.
- Example: three consecutive bullish (green) candles in an uptrend, or three consecutive bearish (red) candles in a downtrend.
Fourth Candle (The Strike Candle)
- Opens beyond the close of the third candle.
- Moves strongly in the opposite direction.
- Its body is large enough to engulf all three previous candles completely.
- This engulfing action is what defines the “strike.”
Basic Components
- Trend Confirmation: The first three candles show momentum in one direction.
- Engulfing Candle: The fourth candle reverses sharply, covering the range of the prior three.
- Visual Signature: A sequence of three smaller candles followed by one dominant candle in the opposite direction.
Why The Three Line Strike Candlestick Pattern Matters
The Three Line Strike candlestick pattern is significant because it captures a sudden shift in market sentiment. While it begins by reinforcing the current trend with three consecutive candles, the fourth candle disrupts that momentum by engulfing all three prior candles. This dramatic reversal or continuation signal can alert traders to potential turning points or renewed strength in the prevailing trend.
Its importance lies in:
- Market psychology: It reflects a battle between trend-followers and contrarians.
- Visual clarity: The engulfing fourth candle is easy to spot, making it accessible for traders of all levels.
- Versatility: It can appear in both bullish and bearish contexts, offering insights across market conditions.
Pros
- Easy to spot visually: The engulfing fourth candle stands out clearly on charts.
- Highlights strong momentum shifts: Captures decisive moves that may signal trend continuation or reversal.
- Works across timeframes: Can be applied to intraday, daily, or weekly charts.
- Supports confirmation tools: Pairs well with volume indicators or trend analysis for added confidence.
Cons
- Can produce false signals: Without confirmation, it may lead to premature trades.
- Context-dependent: Requires broader trend analysis to interpret correctly.
- Relatively rare: Doesn’t appear frequently, limiting its standalone utility.
- Volatility risk: The large fourth candle may reflect short-term noise rather than a true sentiment shift.
Bullish and Bearish Three Line Strikes
The Three Line Strike pattern can appear in both bullish and bearish contexts. Its interpretation depends on the prevailing trend and the direction of the fourth “strike” candle. Below, we break down how each variation forms, supported by visual aids.
Bullish Three Line Strike (How It Forms)

Trend Context: Occurs during an uptrend.
Structure:
- Three consecutive bullish (green) candles appear, each closing higher than the previous one.
- A fourth bearish (red) candle follows.
- This bearish candle is large enough to engulf all three prior bullish candles.
- It typically closes below a key level, often below the open of the first bullish candle.
Candle Count: Always four candles in sequence.
Close Level: The strike candle’s close is critical. It signals whether momentum has shifted or if the move is temporary.
Bearish Three Line Strike (How It Forms)
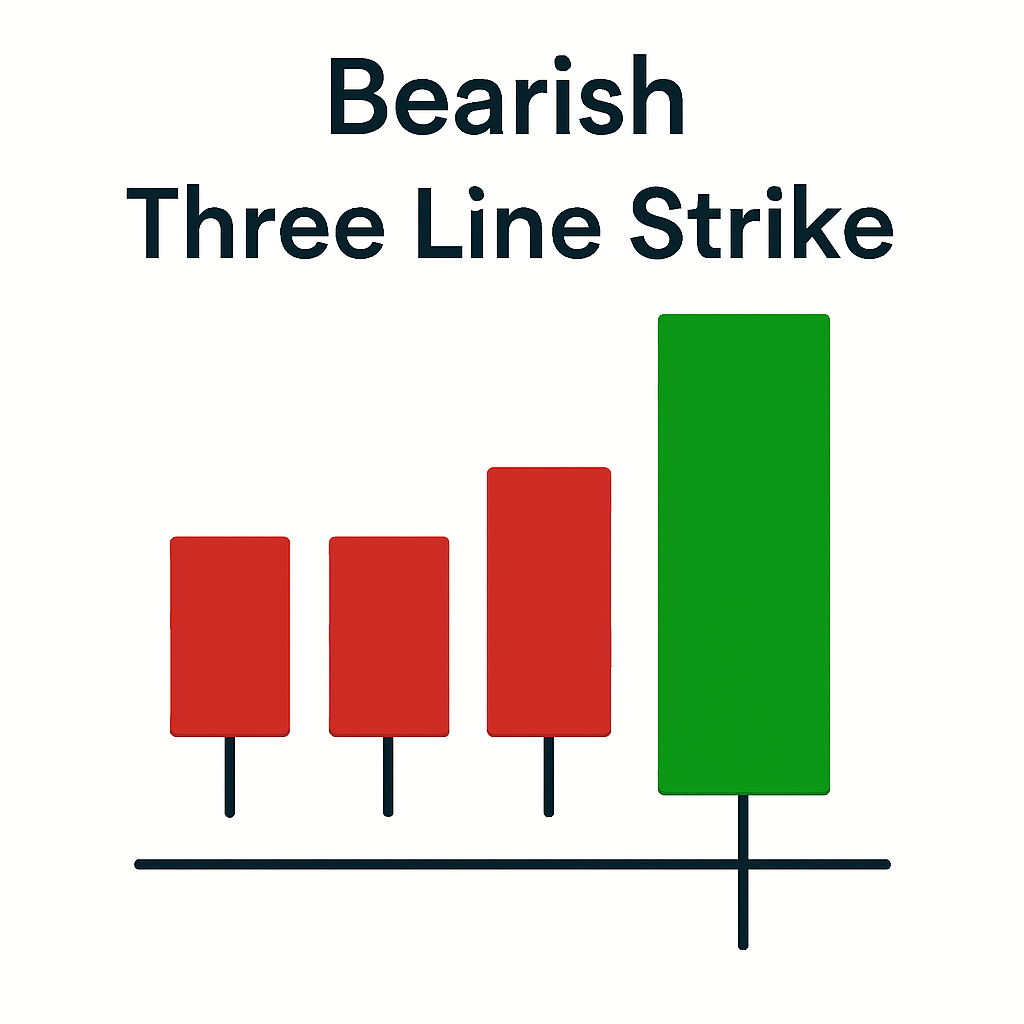
Trend Context: Occurs during a downtrend.
Structure:
- Three consecutive bearish (red) candles appear, each closing lower than the previous one.
- A fourth bullish (green) candle follows.
- This bullish candle is large enough to engulf all three prior bearish candles.
- It typically closes above a key level, often above the open of the first bearish candle.
Candle Count: Always four candles in sequence.
Close Level: The strike candle’s close above prior levels signals a potential shift in sentiment.
How to Identify the Three Line Strike on Charts
Spotting a valid Three Line Strike pattern on crypto charts requires careful attention to candle structure, sequence, and context. Here is a clear, step-by-step guide focused purely on visual identification:
- Start with a clear trend: Look for an existing uptrend (for a bullish setup) or a downtrend (for a bearish setup). The pattern reinforces or challenges this trend.
- Three consecutive candles in the same direction: All three must be bullish (green) or bearish (red). Each candle should close progressively higher (bullish) or lower (bearish). Bodies should be relatively consistent in size. Avoid erratic shapes.
- Fourth candle, the “strike”: Must be in the opposite direction of the first three. Its body must engulf all three prior candles, not just the last one. The open should be beyond the close of the third candle. The close should be beyond the open of the first candle (i.e., a full retracement).
- Engulfing body dominance: The fourth candle’s body, not just its wick, must visibly dominate the prior three. Wicks are allowed, but should not be the only part that overlaps.
- Sequence integrity: The pattern must appear in direct sequence with no gaps or interruptions. No doji, spinning tops, or indecisive candles between the four.
Some common invalid setups include;
- Fourth candle only engulfs one or two candles → Not valid.
- Mixed candle directions in the first three → Breaks the pattern.
- Fourth candle has a small body or long wicks only → Lacks conviction.
- Pattern appears in a choppy or sideways market → No clear trend context.
How to Trade the Three Line Strike Pattern Effectively
Trading the Three Line Strike pattern in crypto markets requires more than just spotting its visual structure, as it demands a disciplined, rules-based approach that balances execution logic with risk management and confirmation. This pattern, while visually striking, can be deceptive without proper context and validation. Beginners should treat it as a signal generator, not a standalone strategy.
The goal is to use the pattern as a trigger within a broader framework that includes entry and exit rules, stop-loss discipline, profit targeting, and indicator-based confirmation. By combining structure-based logic with volatility awareness and trend filters, traders can reduce false signals and improve their decision-making under pressure.
Entry and Exit Rules
To trade the Three Line Strike effectively, you must wait for the pattern to fully complete before entering. This means allowing all four candles to form, with the fourth candle closing beyond the open of the first candle in the sequence. For a bullish setup, this means the large bearish candle closes below the first bullish candle’s open; for a bearish setup, the large bullish candle closes above the first bearish candle’s open.
Entry should be placed at the open of the next candle after confirmation, not mid-pattern. Avoid impulsive trades based on partial formation. For exits, consider time-based logic (e.g., no follow-through after 3–5 candles), structural invalidation (price re-enters the engulfed range), or predefined profit targets. Discipline is the key. Never trade this pattern without a clear exit plan.
Stop-Loss Placement Techniques
Stop-loss placement for the Three Line Strike should be both logical and adaptive. The most common method is structure-based: placing the stop just beyond the high or low of the fourth candle (depending on direction). This protects against invalidation while allowing room for natural price movement.
For bullish setups, the stop goes below the strike candle’s low; for bearish setups, above its high. To account for volatility, traders can use the Average True Range (ATR) to add a buffer, e.g., placing the stop 1×ATR beyond the strike candle’s extreme. This helps avoid getting stopped out by noise.
Importantly, if the price closes back inside the range of the first three candles, the setup is invalidated, and the stop should be honored. Never widen stops emotionally. Use structure and volatility as your guide.
Take-Profit Targeting Methods
Profit targeting should be simple, structured, and adaptable. A common approach is to use fixed risk–reward ratios, such as 2:1 or 3:1. For example, if your stop-loss is $100 below entry, aim for $200–$300 above it. This ensures consistent reward-to-risk logic. Alternatively, dynamic exits can be based on support/resistance zones, Fibonacci extensions, or trailing stops.
For instance, you might take partial profit at 1:1 and trail the rest using a moving average or candle-based logic. Time-based exits are also useful. If the price hasn’t moved significantly after 3–5 candles, consider closing the trade or tightening your stop.
Avoid greed-driven targets; instead, use structure and volatility to guide realistic expectations. The goal is consistency, not perfection.
Indicator Confirmation for Higher-Probability Trades
Using indicators to confirm the Three Line Strike pattern can dramatically improve trade quality. Volume is a primary filter. Look for a spike on the fourth candle to validate momentum. RSI can help identify overbought or oversold conditions, especially if divergence is present.
For example, a bullish strike with RSI divergence from a recent low adds credibility. MACD crossovers or moving average slopes can confirm trend alignment. Avoid trading against strong indicator trends. Trend filters, such as the 20- or 50-period EMA, help ensure you are trading with the broader market direction.
These indicators aren’t meant to clutter your chart; they are meant to validate the setup and filter out low-probability trades. Use them as confirmation tools, not decision-makers.
Best Practices for Using the Three-Strike Law
Here are practical, actionable tips to help traders apply the Three Line Strike candlestick pattern consistently in crypto markets while avoiding common mistakes:
- Wait for full pattern completion: Always allow all four candles to form before making decisions. Acting on partial setups often leads to false signals and unnecessary losses.
- Confirm with broader trend context: Ensure the pattern appears within a clear uptrend or downtrend. Avoid trading Three Line Strikes in sideways or choppy markets where signals are unreliable.
- Use disciplined entry and exit rules: Enter only after the fourth candle closes and confirms the engulfing pattern. Plan exists in advance, whether through fixed risk–reward ratios, support/resistance levels, or time-based rules.
- Apply strict stop-loss placement: Place stops beyond the high or low of the strike candle, or use volatility-based buffers (like ATR). Never widen stops emotionally; let structure dictate risk limits.
- Target profits logically: Use consistent risk–reward ratios (2:1 or 3:1) or dynamic exits based on market structure. Avoid greed-driven targets that ignore volatility and context.
- Seek indicator confirmation: Validate the setup using supporting tools such as volume spikes, RSI divergence, or moving-average alignment. This filters out low-quality signals and improves probability.
- Avoid overtrading the pattern: The Three Line Strike is relatively rare. Don’t force trades when conditions aren’t met. Patience is part of discipline.
- Document and review trades: Keep a trading journal to track how the pattern performs in different market conditions. Reviewing past trades helps refine execution and avoid repeating mistakes.
Final Thoughts
The Three Line Strike candlestick pattern is a powerful visual tool for understanding momentum shifts in crypto markets. While it can provide clear signals, its true value lies in how traders apply it with discipline, context, and proper risk management. By waiting for full pattern completion, confirming with indicators, and respecting stop-loss and take-profit rules, traders can avoid common pitfalls and use the pattern as part of a structured approach rather than chasing every signal.
If you are ready to deepen your knowledge and learn how to apply candlestick patterns, technical analysis, and DeFi strategies with confidence, consider signing up for Dypto Crypto. Our platform is designed to help traders of all levels build practical skills, stay disciplined, and grow in the fast-moving world of crypto trading.
Frequently Asked Questions
Is the Three Line Strike reliable in crypto trading?
The Three Line Strike is not highly reliable on its own in crypto trading. While visually clear, it often produces false signals in volatile markets. Traders should treat it as a secondary tool, using confirmation from trend analysis, volume, and indicators before acting on the pattern.
Is the Three Line Strike a reversal or continuation pattern?
The Three Line Strike can act as both a reversal and a continuation pattern, depending on context. Structurally, it shows three candles in one direction, followed by a large engulfing candle in the opposite direction. Traders often interpret it as a reversal, but confirmation is essential before acting.
Does the Three Line Strike work on lower timeframes in crypto?
Yes, the Three Line Strike can appear on lower timeframes in crypto charts, but reliability decreases due to higher market noise and volatility. Shorter intervals often produce false signals, so traders should use confirmation tools, such as volume or trend indicators, before acting on the pattern.
What are the best indicators that work well with Three Line Strike?
The best indicators to use with the Three Line Strike candlestick pattern are those that confirm momentum and trend strength. Traders often rely on volume spikes to validate conviction behind the strike candle, RSI to spot overbought/oversold conditions or divergence, and moving averages/MACD to confirm broader trend direction.
Disclaimer
This article is for educational and information purposes, and should not be considered financial advice. For more information visit our disclaimer page
About the Author