When crypto markets swing between fear and opportunity, few chart setups capture traders’ attention like the double bottom. It is not just another pattern; it is a signal of shifting sentiment, with sellers losing steam and buyers beginning to reclaim control. For traders, spotting this transition can mean the difference between catching a major reversal early or being left behind as momentum builds.
In the fast‑moving world of Bitcoin, Ethereum, and altcoins, the double bottom stands out for blending psychology with structure: two defended lows, a neckline barrier, and the battle between supply and demand playing out in real time. But recognizing it correctly is where skill comes in. Many traders misinterpret noise as a setup or jump in too early without waiting for confirmation.
This article cuts through the confusion. You will see real crypto chart examples, learn practical trading approaches, and uncover common mistakes to avoid. Most importantly, you will walk away with actionable tips for consistently applying the double bottom pattern, even in volatile crypto markets.
Keep reading, because by the end, you will know how to separate weak imitations from high‑quality setups, and how to use this classic formation as a reliable tool in your trading arsenal.
What Is the Double Bottom Pattern?
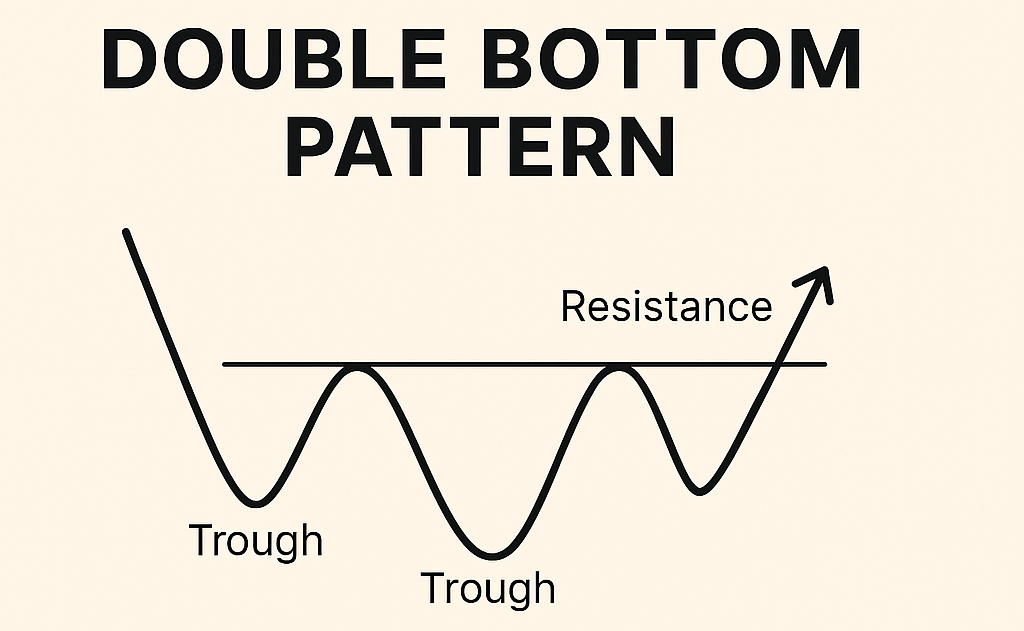
The double bottom pattern is a bullish reversal chart formation that signals the potential end of a downtrend and the beginning of an upward move. It is visually recognized by its “W” shape, formed by two consecutive troughs at roughly the same price level.
It is a technical analysis formation that indicates a major reversal from bearish to bullish sentiment. It occurs when a security’s price declines, rebounds, falls again to a similar level, and then rises once more, forming two distinct lows. The pattern is confirmed when the price breaks above the resistance line (neckline) drawn between the two troughs.
The basic structure of the double bottom pattern is represented by;
- First Trough: The initial low after a downtrend.
- Intervening Peak: A rebound that creates temporary resistance.
- Second Trough: Another decline to approximately the same level as the first trough, showing support.
- Breakout Above Resistance: The final upward move that confirms the reversal.
This structure resembles the letter “W”, making it easy to identify visually. The double bottom pattern helps analysts and traders identify potential trend reversals. It reflects a shift in market psychology: sellers lose strength after failing to push prices lower twice, while buyers gain confidence. It typically appears after a prolonged downtrend, signaling that bearish momentum may be exhausted.
How Double Bottom Signals a Trend Reversal
The double bottom pattern signals a trend reversal because it reflects a psychological shift in market sentiment, from bearish dominance to bullish control, driven by seller exhaustion and increasing buyer strength. This transition is confirmed when buyers overcome resistance, indicating renewed upward momentum.
- Phase One – Bearish Control and First Trough: The market is in a downtrend, with sellers (bears) in control. Prices fall until they reach a support level where selling pressure begins to weaken. The first trough forms as buyers cautiously step in to absorb the excess supply.
- Phase Two – Temporary Rebound and Resistance Formation: After the first trough, prices rebound due to short-covering and opportunistic buying. This rebound is typically weak, forming a temporary peak, known as the resistance level. Sellers return, attempting to push prices lower again, but the momentum is less aggressive than before.
- Phase Three – Second Trough and Seller Exhaustion: Prices decline again but fail to break significantly below the first trough. This failure signals seller exhaustion, as bears can no longer drive prices lower. Meanwhile, buyers absorb the remaining supply, showing growing confidence and strength.
- Phase Four – Breakout and Bullish Shift: As buyers gain control, the price rises toward the resistance level. A breakout above resistance confirms that bulls have overtaken bears. This breakout marks the psychological shift from fear to optimism, validating the trend reversal.
| Element | Psychologica Warning |
| Two Equal Troughs | Sellers failed twice to push prices lower |
| Rising Volume (often) | Buyers are gaining conviction and momentum |
| Resistance Breakout | Bulls overpower bears, initiating an uptrend |
| “W” Shape | Visual cue of failed bearish continuation |
The double bottom is not just a chart shape; it is a narrative of market sentiment. Bears lose steam, bulls regroup, and control shifts. It is especially powerful when confirmed by volume increase, indicating strong buyer participation.
Anatomy of the Double Bottom: Breaking It Down
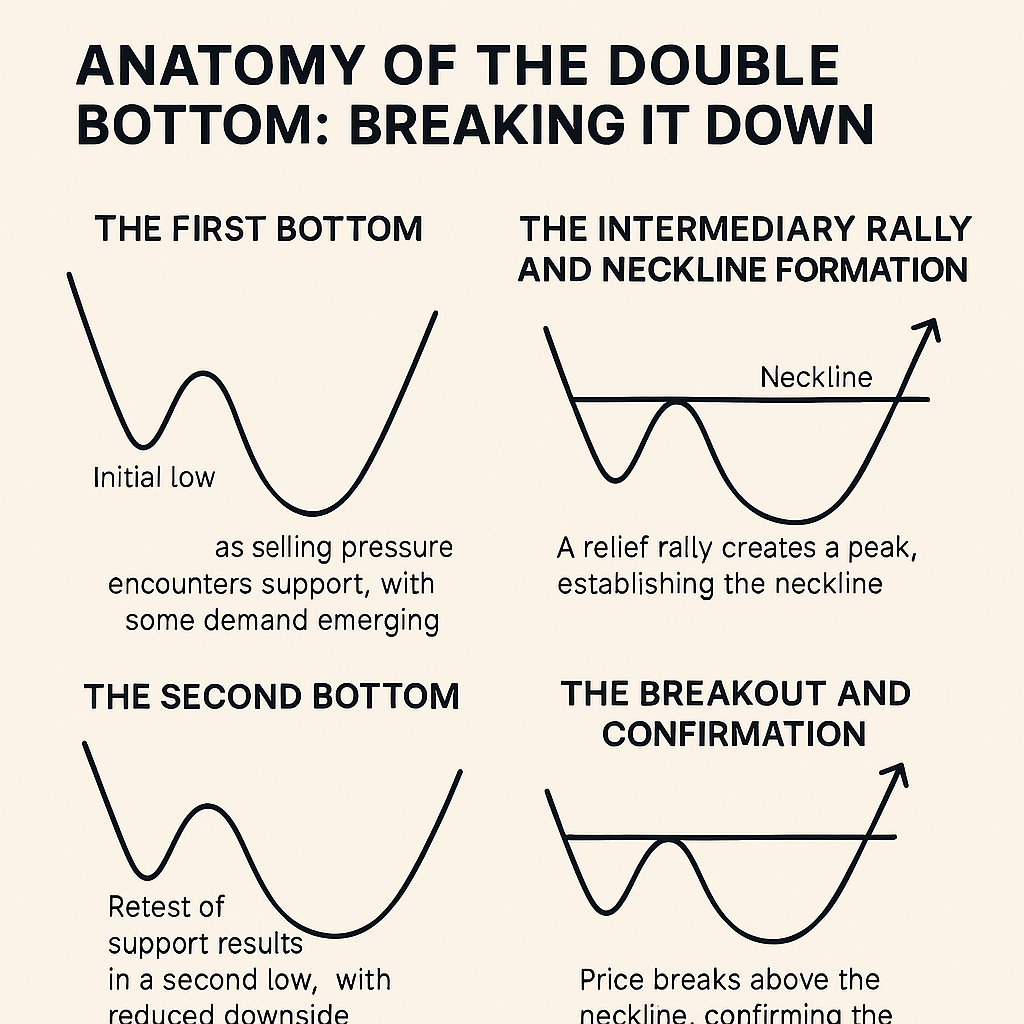
The double bottom pattern unfolds in four distinct phases, each of which is critical to confirming a valid bullish reversal setup. It begins with a sharp decline into the first trough, followed by a rebound that forms the neckline, a second retest of support, and finally a breakout above resistance. Skipping any phase weakens the pattern’s reliability.
The First Bottom
- Selling Pressure Peaks: The pattern begins during a downtrend, where bearish momentum drives prices lower.
- Support Interaction: As price approaches a key support level, selling slows, often due to prior historical demand zones.
- Early Demand Signals: Buyers cautiously enter, absorbing supply. This creates a temporary price floor, forming the first trough.
- Psychological Shift Begins: Though bears are still in control, the inability to push lower hints at potential exhaustion.
The Intermediary Rally and Neckline Formation
- Relief Rally: After the first bottom, the price rebounds as short sellers take profits and buyers test the waters.
- Neckline Formation: This rally stalls at a resistance level, often a prior support or congestion zone, creating the neckline.
- Key Reference Point: The neckline becomes the benchmark for confirmation. A future breakout above this level signals a shift in control from bears to bulls.
- Volume Insight: Volume may increase slightly, but conviction is still tentative.
The Second Bottom
- Retest of Support: Price declines again, revisiting the same support level as the first bottom.
- Reduced Downside Momentum: Unlike the first drop, this decline is often shallower and slower, showing diminished bearish strength.
- Behavioral Differences: Buyers step in earlier, and volume may rise, indicating growing confidence.
- Double Confirmation: The second trough validates the support level and sets the stage for reversal.
The Breakout and Confirmation
- Neckline Break: Price rallies again and breaks above the neckline, confirming the pattern.
- Confirmation Criteria: Close above neckline (not just intraday spike). Volume surge (shows buyer conviction)
- Why It Matters: This breakout is the final psychological shift; bulls have absorbed supply and now dominate.
- No Trade Yet: While this confirms the pattern, it doesn’t dictate entry. It simply validates the setup’s integrity.
How to Identify a Valid Double Bottom Pattern in Crypto
Spotting a genuine double bottom in crypto markets requires more than just noticing two price lows. A systematic approach ensures that traders distinguish between noise and meaningful reversal structures.
Analyzing Market Context
- Prior Trend Direction: A double bottom is a reversal pattern, so it carries weight only after a clear downtrend. Without preceding bearish momentum, the setup loses significance.
- Broader Market Conditions: Patterns are more reliable when aligned with macro sentiment. For example, a double bottom that forms during a broader crypto recovery phase has a higher success rate than one that forms in isolation.
- Structural Support Zones: The two bottoms should occur near a well-defined support level, a historical demand zone, a psychological round number, or an area of high liquidity. This increases the probability that buyers will defend the level.
Choosing the Right Timeframe
- Lower Timeframes (1m–1h): More frequent but prone to false signals due to volatility and noise. Useful for scalpers but less reliable for swing traders.
- Higher Timeframes (4h–1D+): Provide stronger validation since institutional flows and broader sentiment are reflected. Patterns here are less common but carry greater weight in confirming reversals.
- Guideline: The higher the timeframe, the more reliable the double bottom. Lower timeframes should be cross-checked against higher ones for confluence.
Recognizing Confirming Price Action
- Symmetry of Bottoms: Both lows should be relatively close in price, showing consistent defense of the support zone.
- Higher Low Between Bottoms: A slight upward drift between the two bottoms signals waning selling pressure.
- Strong Closes Above Midpoint: Candles that close firmly above the midpoint of the pattern (between the two bottoms) indicate that buyers are regaining control.
- Rejection Wicks: Long lower wicks at the bottoms suggest aggressive buying interest and liquidity absorption.
Understanding Volume Behavior in Each Phase
- Decline Phase: Volume typically rises as sellers dominate, pushing price into the first bottom.
- Second Bottom: Volume often diminishes, reflecting reduced selling conviction. A lack of aggressive sell pressure here is a key validation point.
- Breakout Phase: A valid double bottom requires a surge in volume on the breakout above the neckline (the resistance between the two bottoms). This confirms genuine buying interest rather than a weak bounce.
Double Bottom vs Double Top Pattern: Key Differences
Both the double bottom and the double top are classic reversal patterns, but they mirror each other in terms of psychology and directional bias. Here’s a systematic comparison focused on recognition and interpretation:
- Structural Differences: A Double Bottom forms when price creates two consecutive lows at similar levels, with a neckline that acts as resistance at the midpoint of the peak. A Double Top forms when price creates two consecutive highs at similar levels, with a neckline providing support across the midpoint trough.
- Market Psychology: A Double Bottom signals that sellers have failed twice to break support, indicating weakening bearish pressure and growing buyer confidence. A Double Top signals that buyers have failed twice to break resistance, indicating weakening bullish pressure and growing seller confidence.
- Trend Context: Double Bottom typically appears after a downtrend, signaling potential exhaustion of bearish momentum and often aligning with major support zones. A Double Top typically appears after an uptrend, signaling potential exhaustion of bullish momentum and often aligning with major resistance levels.
- Directional Bias: A Double Bottom carries a bullish reversal bias, suggesting the price will move upward once confirmed. A Double Top carries a bearish reversal bias, shifting the price direction downward once confirmed.
Real Crypto Chart Examples of Double Bottom Patterns
Valid double bottoms require two defended lows, a clear neckline, a strong breakout close, and volume-backed retest. Failed patterns often show weak breakout volume, lack of retest strength, or occur in unfavorable macro conditions. Here are real crypto chart examples of valid double bottom patterns in BTC, ETH, and altcoins.
1. Bitcoin (BTC/USDT)
- Timeframe: Daily chart
- Date Range: June–July 2021 (post-China mining ban crash)
- Two Low Levels: ~$29,200 (June 22) and ~$30,000 (July 20)
- Neckline Level: ~$41,000
- Confirmation: Price closed above $41,000 on July 23 and retested the neckline successfully before rallying toward $52,000.
- Interpretation: Sellers failed twice at the $30k support zone, and volume surged on the breakout, confirming a bullish reversal.
2. Ethereum (ETH/USDT)
- Timeframe: Daily chart
- Date Range: March–April 2020 (COVID crash recovery)
- Two Low Levels: ~$90 (March 13) and ~$100 (March 20)
- Neckline Level: ~$140
- Confirmation: ETH closed above $140 in early April and retested the neckline before climbing toward $250.
- Interpretation: The second low held higher volume support, and the breakout candle closed strongly above the neckline resistance.
3. XRP (XRP/USDT)
- Timeframe: Weekly chart
- Date Range: 2023–2025 (multi-year base)
- Two Low Levels: ~$0.30 (June 2023) and ~$0.32 (October 2023)
- Neckline Level: ~$0.55
- Confirmation: XRP closed above $0.55 in mid-2025, retested neckline support, and then advanced toward $1.00.
- Interpretation: A long accumulation zone with diminishing sell volume set the stage for a strong breakout.
Failed Example – Cardano (ADA/USDT)
- Timeframe: Daily chart
- Date Range: September–October 2022
- Two Low Levels: ~$0.42 (Sept 21) and ~$0.43 (Oct 13)
- Neckline Level: ~$0.50
- Failure Reason: Price briefly closed above $0.50 but lacked volume confirmation. The retest failed when ADA fell back below the neckline, invalidating the pattern.
- Interpretation: Weak breakout volume and broader bearish market sentiment (crypto winter) led to the setup failing, underscoring the importance of confirmation beyond a neckline close.
How to Trade the Double Bottom Pattern in Crypto
Trading the double bottom in crypto is about disciplined execution: entering on a breakout or confirmation, protecting capital with logical stops, projecting realistic targets, and maintaining a favorable risk-to-reward ratio. This systematic approach helps traders stay consistent even in volatile conditions. Below is a breakdown of practical methods tailored for crypto markets.
Entry Strategies
- Breakout-Based Entry: Traders often enter once the price closes above the neckline (the resistance between the two bottoms). This approach captures momentum as buyers confirm control.
- Confirmation-Driven Entry: More conservative traders wait for a retest of the neckline after the breakout. A successful retest, often marked by rejection wicks or strong closes, reduces the risk of false breakouts.
- Reasoning: Breakout entries maximize early participation, while confirmation entries prioritize reliability. The choice depends on risk tolerance and trading style.
Stop-Loss Placement Techniques
- Below the Second Bottom: A logical stop-loss sits just under the second low, since a break below invalidates the pattern.
- Volatility Buffer: In highly volatile crypto markets, stops may be placed slightly below structural support to avoid being triggered by noise.
- Dynamic Adjustment: Traders can refine stop placement using ATR (Average True Range) or recent swing lows to account for market volatility.
Profit Target Calculations
- Pattern Measurement: Measure the distance from the neckline to the bottom. Project this distance upward from the neckline to estimate a realistic target.
- Resistance Levels: Identify nearby horizontal resistance zones or psychological price levels (e.g., round numbers like $50,000 BTC). These often act as profit-taking points.
- Market Structure: In trending markets, traders may extend targets toward higher timeframe resistance, while in choppy conditions, conservative targets are more prudent.
Risk-to-Reward Optimization for Crypto Trades
- Assessing Ratios: Aim for setups with a reward-to-risk ratio of at least 2:1. This ensures profitability even with moderate win rates.
- Position Sizing: Adjust trade size based on stop distance and account risk tolerance (e.g., risking 1–2% of capital per trade).
- Avoiding Low-Quality Setups: Skip trades where neckline resistance is weak, breakout volume is lacking, or broader market sentiment is unfavorable. Consistency comes from filtering for high-quality confirmations rather than chasing every pattern.
Common Mistakes Crypto Traders Make with Double Bottoms
The double bottom is powerful when applied correctly, but its reliability depends on context, confirmation, volume analysis, and disciplined risk control. Missteps in these areas transform a high-quality reversal setup into a high-risk gamble. Even though the double bottom is a well-known reversal pattern, many traders misapply it in crypto markets. These errors reduce reliability and increase risk, especially in volatile conditions.
Trading the Pattern Without a Prior Downtrend
A double bottom is a reversal pattern, meaning it only carries weight after a clear downtrend. When traders attempt to trade it in sideways or already bullish markets, the setup loses its psychological foundation. Without preceding bearish momentum, the two lows may simply represent consolidation rather than a genuine reversal, weakening the pattern’s validity.
Entering Before Confirmation
Premature entries are one of the most common mistakes. Traders often jump in after spotting two lows but before the price closes above the neckline. This exposes them to false breakouts, where the price briefly rises above resistance but quickly falls back. Ignoring confirmation, such as a strong close or successful retest, turns the pattern into guesswork rather than a structured signal.
Ignoring Volume and Liquidity Sweeps
Volume plays a critical role in validating double bottoms. A genuine breakout should be accompanied by rising buy-side volume. Traders who overlook this may misinterpret weak rallies as confirmed reversals. Similarly, liquidity sweeps, in which price dips below the prior low to trigger stop-losses before reversing, can be mistaken for a pattern failure. Recognizing these behaviors helps distinguish between false signals and genuine accumulation.
Overleveraging in Volatile Conditions
Crypto’s volatility magnifies both gains and losses. Even when a double bottom appears valid, excessive leverage can turn minor retracements into catastrophic losses. Traders who overexpose themselves often fail to account for volatility buffers, leading to liquidation even when the pattern eventually plays out. Proper risk management is essential to avoid amplifying losses in such conditions.
Practical Double Bottom Trading Tips for Crypto Markets
Double bottoms are most reliable when aligned with strong support/resistance, filtered against disruptive news events, and adapted for the unique volatility of altcoins. Consistency comes from respecting context, not just the pattern itself. Here are actionable tips that improve consistency and reliability.
Using Support & Resistance Confluence
A double bottom gains strength when it aligns with major support and resistance zones. If the two lows form at a historically defended support level, it signals that buyers are stepping in where demand has previously been strong. Similarly, a neckline that coincides with a known resistance zone adds credibility; breaking through it confirms that market sentiment has shifted. This confluence reduces false signals and increases the likelihood of a sustained reversal.
Filtering Setups During High-Impact News Events
Crypto markets are highly sensitive to macro news, regulatory updates, and project-specific announcements. Even a technically perfect double bottom can fail if sudden volatility distorts price action. For example, central bank rate decisions, SEC rulings, or major exchange hacks can trigger liquidity spikes that invalidate setups. The practical tip is to avoid trading double bottoms during these periods or wait until the news-driven volatility subsides. Filtering out setups in unstable conditions preserves capital and consistency.
Adapting the Pattern for High-Volatility Altcoins
Altcoins often exhibit sharper price swings and thinner liquidity than BTC or ETH. This means double bottoms on altcoins require:
- Wider Confirmation Buffers: Don’t rely on marginal neckline breaks; wait for strong closes well above resistance.
- Flexible Targets: Altcoins can overshoot or underperform pattern projections, so use nearby resistance zones rather than rigid measurements.
- Tighter Risk Management: Volatility can trigger stop losses quickly, so position sizing should be smaller, and stops should account for exaggerated wicks.
By adapting expectations and risk controls, traders can still apply the double bottom framework effectively in altcoin markets without being caught off guard by volatility.
Wrapping It Up
The double bottom pattern is one of the most reliable reversal structures in crypto when applied with discipline and context. Its strength lies in appearing after a clear downtrend, forming around well‑defined support zones, and confirming with a decisive breakout backed by volume.
- Always validate the pattern against prior trend direction and structural levels.
- Wait for confirmation through neckline breaks and retests rather than rushing into premature entries.
- Factor in volume dynamics and broader market conditions to filter out weak setups.
- Applying consistent risk management, such as logical stop placement, realistic profit targets, and favorable risk‑to‑reward ratios are essential for long‑term success.
By adhering to these best practices, traders can improve the reliability of double-bottom setups and avoid common pitfalls. The goal is not to chase every pattern but to apply a disciplined, systematic approach that turns a familiar chart formation into a consistent trading edge.
Frequently Asked Questions
Is the double bottom pattern bullish or bearish?
The double bottom pattern is bullish. It signals a potential reversal after a downtrend, showing that sellers failed twice to push the price lower and buyers regained control. Confirmation comes when price breaks above the neckline with strong volume, indicating upward momentum and renewed market confidence.
Is a double bottom a candlestick pattern?
No, a double bottom is not a candlestick pattern. It is a chart pattern formed by price action that creates two consecutive lows at similar levels, signaling a potential reversal. While candlesticks help visualize it, the double bottom relies on overall structure, trend context, and neckline confirmation.
Do the two bottoms have to be equal?
No, the two bottoms do not have to be perfectly equal. What matters is that they are relatively close in price and show consistent support. Slight variations are normal in volatile crypto markets, as long as the structure reflects seller exhaustion and the neckline breakout confirms buyer strength.
What confirms a double bottom pattern?
A double bottom pattern is confirmed when the price breaks above the neckline, the resistance between the two lows, with strong volume support. Ideally, the breakout is followed by a successful retest of the neckline, showing buyers have taken control and validating the bullish reversal structure.
Can the double bottom pattern fail?
Yes, the double bottom pattern can fail. If breakout volume is weak, the neckline retest doesn’t hold, or broader market sentiment remains bearish, the price may fall back below support. In crypto’s volatile environment, false signals are common, making confirmation and disciplined risk management essential.
Which timeframe works best for double bottom patterns in crypto?
Higher timeframes, such as 4‑hour and daily charts, work best for double bottom patterns in crypto. They filter out short‑term noise, provide stronger confirmation, and reflect broader market sentiment. Lower timeframes can produce false signals, so higher-timeframe setups are generally more reliable for reversals.
Disclaimer
This article is for educational and information purposes, and should not be considered financial advice. For more information visit our disclaimer page
About the Author