You’re staring at a Bitcoin chart, watching the price bounce around like it has too much caffeine. One minute it’s climbing, the next it’s dropping 5%. How do you even begin to make sense of this chaos?
Enter Bollinger Bands, one of the most practical tools for reading crypto volatility. These three simple lines on your chart can tell you when the market is coiling up for a big move, when it’s overextended, and when conditions favor mean reversion versus breakouts. Traders who understand Bollinger Bands gain an edge in timing entries and exits, especially in markets as wild as crypto.
Here’s what makes them valuable. Unlike static support and resistance lines, Bollinger Bands adjust dynamically based on recent volatility. When the market gets choppy, the bands widen. When things calm down, they tighten. This responsive behavior gives you real-time context about what’s actually happening, not just what happened weeks ago.
But here’s the catch. Bollinger Bands aren’t magic. They don’t predict the future, and using them blindly leads to losses just as fast as ignoring them completely. You need to understand what they’re showing you, which setups actually work, and how to combine them with other confirmation tools.
In this guide, we’ll break down everything you need to know about using Bollinger Bands for crypto trading. What they are, how to read them on live charts, proven strategies that work in crypto markets, how to set them up properly, their reliability and limitations, and critical risk management practices. Whether you’re day trading altcoins or swing trading Bitcoin, these techniques will sharpen your analysis and improve your timing.
Let’s get into it.
What Are Bollinger Bands?
Bollinger Bands are a technical indicator consisting of three lines plotted on a price chart. The middle band is a simple moving average (usually 20 periods), and the upper and lower bands sit at a set distance above and below it (typically two standard deviations). Together, these bands create a dynamic envelope that expands and contracts based on market volatility.
John Bollinger developed this tool in the 1980s specifically to measure and visualize volatility. The core concept is straightforward. When markets become more volatile, the bands widen to contain the larger price swings. When volatility drops and prices consolidate, the bands narrow. This visual representation helps traders quickly assess whether the market is calm or chaotic.
Why are Bollinger Bands especially useful for crypto? Simple, crypto markets are insanely volatile compared to traditional assets. Bitcoin can easily move 10% in a day, altcoins can double or get cut in half within weeks. Traditional technical tools designed for stable stock markets often fail in crypto’s extreme conditions. Bollinger Bands adapt to this volatility automatically, making them more relevant than fixed indicators.
The middle band (the 20-period simple moving average) represents the recent average price. Price tends to revert toward this mean over time. The upper and lower bands show where price is statistically “expensive” or “cheap” relative to recent behavior. Under normal conditions, roughly 95% of price action occurs within these bands.
When price touches or breaks the upper band, it signals strong upward momentum or potentially overbought conditions. When it touches the lower band, it shows downward pressure or oversold conditions. The space between the bands, the bandwidth, tells you how much volatility the market is experiencing right now.
Here’s what traders watch for. Band squeezes (when bands tighten) often precede significant moves, band expansions (widening) confirm trending markets and high volatility, price walking the upper or lower band indicates strong trends, and price bouncing between bands suggests range-bound conditions.
Think of Bollinger Bands as a context tool. They frame the current market state, but you provide the interpretation based on volume, trend, and overall market conditions. Used properly, they help you avoid entering trades at terrible times and help you spot high-probability setups when conditions align.
How to Read Bollinger Bands on a Crypto Chart
Reading Bollinger Bands effectively means understanding what different formations and price behaviors actually signal. Let’s break down what you’re looking at when you pull up a crypto chart.
Band Width and Volatility
The distance between the upper and lower bands directly reflects recent volatility.
- Wide bands → High volatility; prices are swinging dramatically.
- Tight bands → Low volatility; prices are moving in a narrow range.
Paying attention to bandwidth changes gives warning of shifts in market conditions.
When bands are squeezed tight (the “Bollinger Squeeze”):
- Volatility is compressed.
- This occurs during consolidation when the market is undecided.
- Squeezes typically precede explosive moves.
- The longer the squeeze, the bigger the breakout tends to be.
- Think of it as a coiled spring building tension.
When bands expand rapidly:
- Volatility is spiking.
- This happens during strong trends or panic moves.
- Wide bands confirm big money flow and directional conviction.
- These are conditions in which trends often persist.
Price Position Relative to Bands
Price near the upper band:
- Indicates strong buying pressure.
- In uptrends, price may “walk the band,” repeatedly touching or exceeding the upper band.
- Confirms trend strength when pullbacks to the middle band are minimal.
Price near the lower band:
- Indicates strong selling pressure.
- In downtrends, price can also walk the lower band.
- Confirms downtrend strength when price fails to recover to the middle band.
Price oscillating between bands:
- Suggests balanced market conditions.
- Neither buyers nor sellers dominate.
- Typically occurs in range-bound markets, where mean-reversion strategies work best.
The Middle Band’s Role
The middle band (usually a 20-period moving average) acts as dynamic support/resistance.
- In uptrends, price often pulls back to the middle band before continuing higher → potential entry zone.
- In downtrends: price rallies to the middle band before getting rejected → resistance zone.
Crossing the middle band signals potential trend or momentum shifts:
- Below → Above: buyers gaining control.
- Above → Below: sellers taking control.
Volume Context Matters
Bollinger Bands should always be analyzed in the context of volume.
Breakout above the upper band on high volume:
- Signals strong momentum and genuine buying interest.
Breakout on light volume:
- May indicate a false breakout prone to reversal.
Band squeezes with volume spikes:
- Confirm legitimate breakouts.
Squeezes without volume confirmation:
- Can produce head fakes, where price briefly breaks out then reverses.
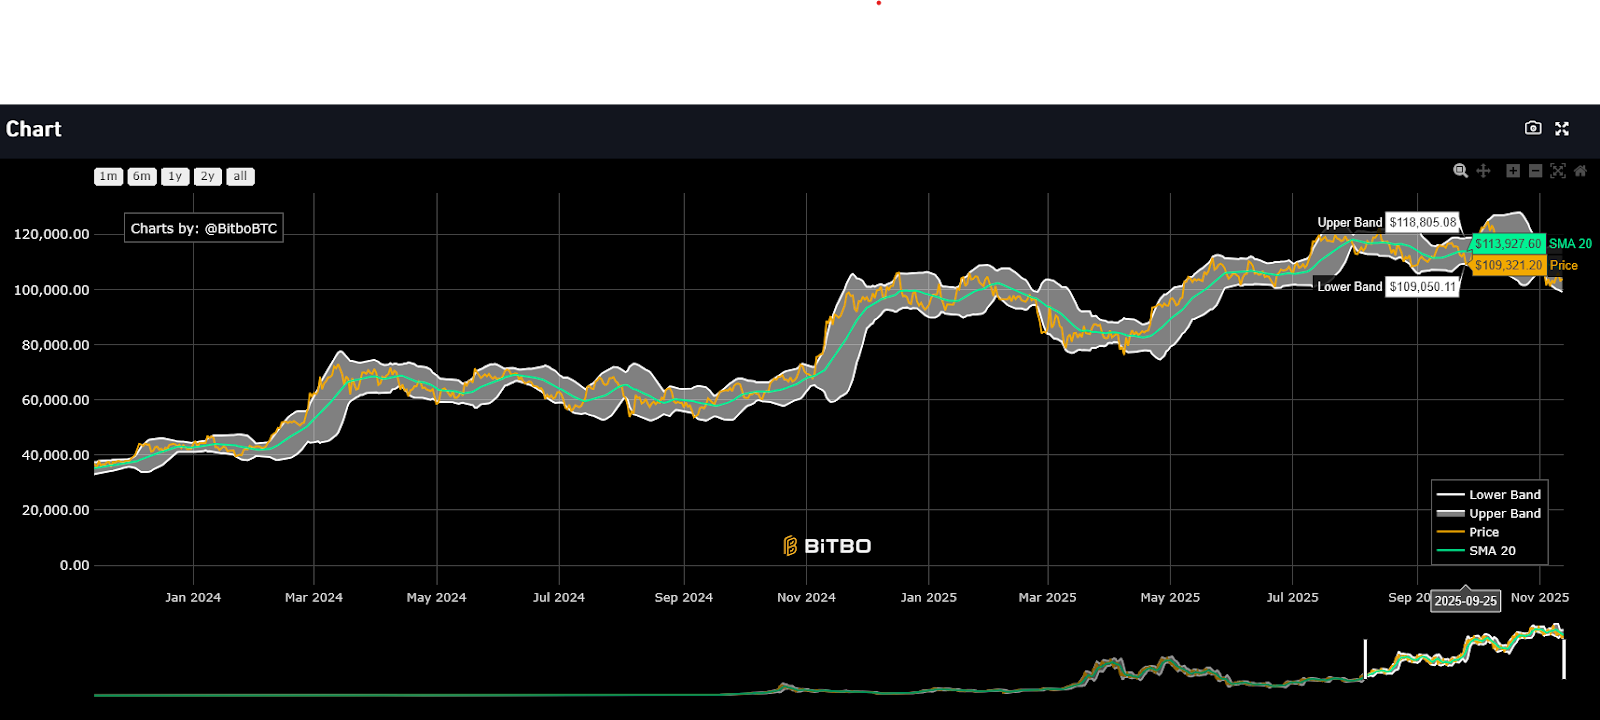
BTC as chart example
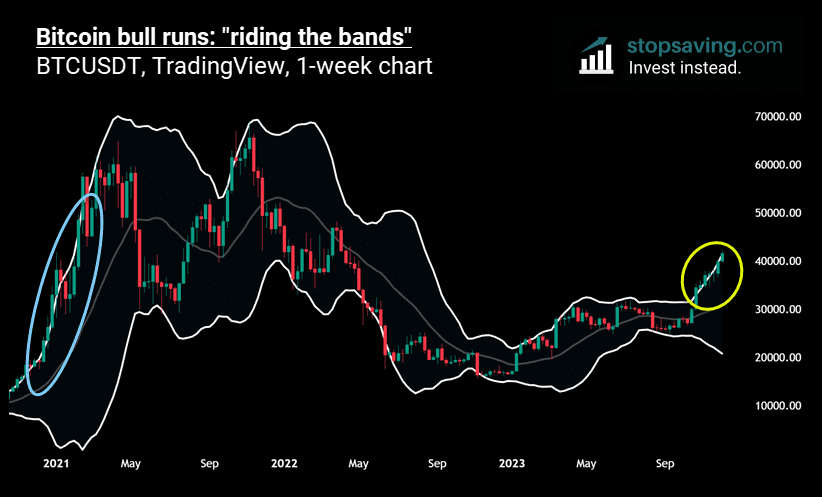
What to look for on the BTC chart
- Bandwidth / Volatility: When you see the outer bands get very narrow (the “squeeze”), it signals low volatility and often a consolidation phase. Then if the bands start expanding, the market may be about to break out.
- Price vs bands:
- If BTC’s price repeatedly touches the upper band and stays near it, that can indicate a strong uptrend (“walking the band”).
- If price hugs the lower band, that suggests a strong downtrend.
- If BTC’s price repeatedly touches the upper band and stays near it, that can indicate a strong uptrend (“walking the band”).
- Middle band role: The middle band (e.g., 20-period SMA) often acts as support/resistance: if price pulls back to it and then bounces, that can be a good entry in a trend.
- Volume context: A breakout from a squeeze is much stronger if it’s accompanied by high volume—if volume is low, it might be a fake breakout. (You’d want to check your chart’s volume bars as well).
Example scenario
On BTC, if you see the bands have been very narrow for a while, that’s the squeeze. Then suddenly, a green candle closes outside (above) the upper band, and volume spikes. You’d interpret that as a possible bullish breakout: price may accelerate upward (rather than immediately revert).
Alternatively, if price is already in an uptrend and you see it riding the upper band, you might stay in the trade rather than treating touches of the band as reversal signals.
Eth as chart example
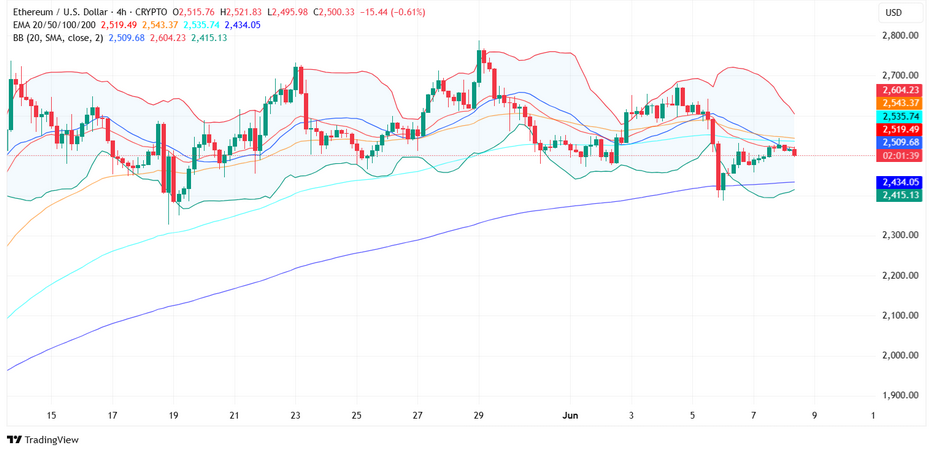
What to watch on the ETH chart
- Just like BTC: look for bandwidth changes, price relative to bands, middle-band behaviour, and volume.
- On ETH, you might see classic “mean-reversion” behaviour: in a ranging market, price touches the lower band, then comes back toward the middle band. That’s more likely when the bands are narrow and the market is not trending.
- If you spot ETH in a strong trend: price hugging the upper band (for an uptrend) or the lower band (for a downtrend) — treat those touches as continuation rather than reversal.
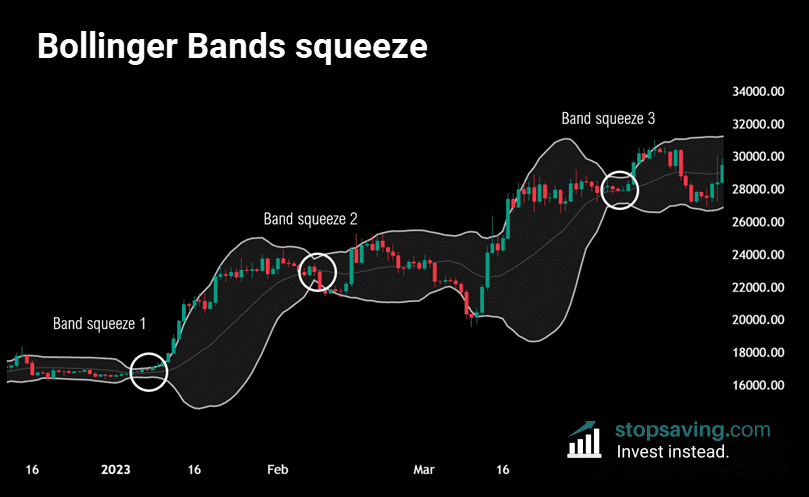
Example scenario
Suppose ETH has been consolidating: bands are narrowing. Then a candle breaks below the lower band and volume jumps. That could signal a bearish breakout. If you see that, you might consider a short / sell (if your strategy allows) or at least be cautious about a long position.
Trading Strategies Using Bollinger Bands
Theory is useful, but strategies are what actually make money. Here are the most effective ways to trade crypto using Bollinger Bands, with specific entry and exit rules for each.
Bollinger Band Squeeze
The squeeze is arguably the most powerful Bollinger Band pattern. When bands contract to extremely tight levels, volatility is at a low point. Markets don’t stay calm forever; squeezes always resolve into breakouts eventually.
How to identify a squeeze: Look for bands that have narrowed significantly compared to recent periods. The bands should be the tightest they’ve been in weeks or months. Volume often drops during squeezes as traders wait for direction.
How to trade it: You can’t predict breakout direction from the squeeze alone, so you need confirmation. Wait for price to break decisively above the upper band or below the lower band. Combine this with volume, breakouts on high volume are more reliable. Use momentum indicators such as RSI or MACD to confirm the direction.
Entry: Enter when price closes beyond a band with strong volume. For upside breaks, buy when price closes above the upper band. For downside breaks, short when price closes below the lower band.
Stop loss: Place stops just inside the opposite band. If buying an upside break, stop below the middle band. This protects you if the breakout fails.
Example: Ethereum consolidates between $3,200 and $3,400 for three weeks. Bollinger Bands tighten to just $50 apart. Then ETH breaks above $3,400 on 2x average volume. You enter at $3,410 with a stop at $3,300 (middle band). The bands expand as ETH runs to $3,600, a $200 move from a $50 squeeze.
The Bollinger Bounce – Trading Range Reversals
In range-bound markets, price tends to bounce between the Bollinger Bands like a pinball. When price hits the lower band, it often bounces back toward the middle. When it hits the upper band, it reverses downward. This mean reversion behavior creates reliable short-term trading opportunities.
When this works best: Sideways markets with no clear trend. Bitcoin trading between $90k and $100k for weeks is perfect bounce territory. This strategy fails in strong trends where price walks the bands.
How to trade it: Wait for price to touch or slightly penetrate the lower band, then look for reversal signals. You want confirmation like a bullish candlestick pattern, RSI showing oversold conditions, or volume decreasing on the move to the lower band (suggesting selling exhaustion).
Entry: Enter when price touches the lower band and shows reversal confirmation. Target the middle band for conservative profits or the upper band for aggressive targets.
Stop loss: Place stops slightly beyond the lower band. If price continues falling through the band, the range might be breaking down.
Critical note: Always confirm the market is actually ranging before using bounce strategies. In downtrends, lower bands merely mark pauses before more selling. You’ll get destroyed trying to catch falling knives.
W-Bottoms and M-Tops
These patterns signal potential trend reversals and work exceptionally well with Bollinger Bands. They occur at market turning points and offer high-probability entries when identified correctly.
W-Bottom (Bullish Reversal): This pattern forms in downtrends. Price makes a low that touches or breaks the lower band (first bottom). Then price rallies back above the middle band briefly. Price then declines again, but this second low stays above the lower band and higher than the first low (second bottom). This second low that holds above the band signals selling pressure is exhausted. Entry comes when price breaks back above the middle band after forming the second bottom.
M-Top (Bearish Reversal): The inverse pattern at market tops. Price makes a high near or through the upper band (first top). Pulls back below the middle band. Rallies again but fails to reach the upper band, forming a lower second top. This second top that can’t reach the band shows that buying is exhausted. Entry is when price breaks below the middle band after the second top forms.
These patterns work because they show momentum divergence. The second bottom or top failing to match the first reveals that the trend is weakening. Smart money is already positioning for a reversal.
Scalping with Bollinger Bands
Short-term traders can use Bollinger Bands to quickly profit from rapid price reactions at the bands. This requires fast execution, strict discipline, and constant monitoring.
Setup: Use shorter timeframes, 5-minute or 15-minute charts. Look for price to touch or penetrate bands, then immediately reverse. These quick rejections offer scalping opportunities.
Entry: When the price spikes to the upper band and is immediately rejected (as shown by a large wick and a bearish candle), enter short. When price drops to the lower band and bounces immediately (long wick, bullish candle), enter long.
Stop loss: Tight stops are essential for scalping. Place stops just beyond the band that was touched. You’re trading quick reversions, not long-term trends. If the band doesn’t hold, you exit immediately.
Scalping challenges: This strategy demands attention and quick execution. It’s mentally taxing and transaction fees eat profits. Only scalp on exchanges with low fees and sufficient liquidity. This isn’t a “set it and forget it” approach.
How to Set Up Bollinger Bands for Crypto Trading
Setting up Bollinger Bands is straightforward, but understanding the settings helps you optimize them for crypto’s unique volatility.
Standard Settings
The default Bollinger Band configuration uses a 20-period simple moving average for the middle band and 2 standard deviations for the upper and lower bands. For most crypto traders, these standard settings work perfectly well. John Bollinger designed them to be broadly applicable, and they adapt to different markets automatically through the standard deviation calculation.
When to Adjust Settings
Some traders modify settings based on timeframe or specific strategies. For day trading and scalping on 5-minute or 15-minute charts, some traders use 10 or 15 periods instead of 20 to achieve faster responses. For swing trading on daily charts, standard 20,20,2 works best.
You can also adjust the standard deviation multiplier. Using 1.5 standard deviations makes bands tighter, resulting in more frequent touches. This suits range-trading and mean-reversion strategies. Using 2.5 or 3 standard deviations widens bands, making touches more significant but rarer.
Important note: Don’t over-optimize. The danger of adjusting settings is curve-fitting, making them work perfectly on past data but fail on future data. Standard settings work because they’re not optimized for any specific market.
Setting Up on Trading Platforms
Most platforms make this simple. Here’s how to add Bollinger Bands on popular platforms:
TradingView: Click the Indicators button at the top, search for “Bollinger Bands,” select it, and it applies to your chart. To adjust settings, click the gear icon next to the indicator name.
Binance: Open the trading view, click the Indicators button, search for Bollinger Bands in the menu, and add it. Click settings to adjust parameters if needed.
Coinbase Advanced Trade: Access the charting tools, add Bollinger Bands from the indicators library, and customize settings through the indicator menu.
Most platforms also let you change the visual appearance, line colors, thickness, and whether to shade the area between bands. These cosmetic changes don’t affect the indicator’s function but can make charts easier to read.
How Reliable Are Bollinger Bands in Crypto Trading?
Let’s be honest about what Bollinger Bands can and can’t do. They’re useful tools, but they’re not crystal balls.
Where They Work Best
Bollinger Bands excel in ranging markets. When crypto is consolidating within a defined range, the bounce strategy works remarkably well. Price respects the bands as support and resistance, creating predictable mean reversion opportunities.
Squeeze patterns are also highly reliable for identifying when big moves are coming. The actual direction might be uncertain, but the squeeze correctly signals that volatility compression will resolve. Combined with volume and momentum confirmation, squeeze breakouts offer excellent risk-reward setups.
Where They Struggle
Bollinger Bands don’t predict direction alone. A squeeze tells you a move is coming, but not where. You need additional tools, such as volume analysis, trend identification, and momentum indicators, to determine direction.
In extremely volatile crypto markets, bands can give false signals. When Bitcoin drops 20% in a day due to exchange collapses or regulatory news, Bollinger Bands expand wildly but don’t offer useful guidance.
Reliability Improvements Through Confirmation
The reliability of Bollinger Bands increases dramatically when combined with other indicators. Use volume to confirm breakouts. A squeeze breakout on 3x average volume is far more reliable than one on declining volume.
Add RSI for overbought and oversold confirmation. When the price touches the lower band and RSI shows oversold (below 30), the bounce probability increases. When the price hits the upper band and the RSI is overbought (above 70), the reversal probability increases.
Check MACD for momentum confirmation. When bands squeeze and MACD crosses bullish, the breakout direction becomes clearer. These converging signals significantly improve win rates.
The Bottom Line on Reliability
Bollinger Bands are reliable at identifying volatility conditions, confirming trends, and highlighting potential reversal zones. They’re not reliable at predicting future direction without additional context. Use them as a framework for understanding the current market state, then add confirmation tools to make directional decisions.
Risk Management Strategies When Using Bollinger Bands
Bollinger Bands help identify opportunities, but risk management keeps you alive to trade another day. Here’s how to protect capital while using these strategies.
Position Sizing Based on Volatility
When Bollinger Bands are wide (high volatility), reduce your position size. Markets are swinging more sharply, so your stop-loss needs more room. When bands are tight (low volatility), you can slightly increase position size since stops can be tighter.
A practical rule is to risk 1-2% of your trading capital per trade, adjusted for volatility. In calm markets, risk 2%. In chaotic markets, risk 1% or less.
Stop-Loss Placement
Every single trade needs a stop-loss, no exceptions. Bollinger Bands actually make stop placement logical.
For bounce trades, place stops just beyond the band you’re trading against and buying at the lower band? Stop goes slightly below it. For breakout trades, place stops inside the opposite band or just below the middle band.
Don’t widen stops when trades move against you. That’s emotional decision-making, not risk management. If your stop gets hit, accept the loss and move on.
Take Profit Targets
Define profit targets before entering trades. Bollinger Bands provide natural targets. For range trades, target the middle band (conservative) or opposite band (aggressive). For breakout trades, target a distance equal to the previous band width.
Risk-Reward Ratio Requirements
Only take trades where the potential reward exceeds the potential risk by at least 2:1. If you’re risking $500 to the stop-loss, your target needs to offer at least $1,000 in profit.
Bollinger Band setups often offer excellent risk-reward ratios. A squeeze breakout might risk $500 to the middle band while targeting $2,000 to the projected extension. That’s 4:1.
Avoiding Overtrading
Just because Bollinger Bands show a setup doesn’t mean you must trade it. Wait for the best setups with multiple confirming factors. Quality over quantity applies to trading.
Capital Preservation First
Your primary job as a trader isn’t making money, it’s not losing money. Preserve capital through careful position sizing, strict stops, and selective entry criteria. Do this consistently, and the profits take care of themselves over time.
What to Learn More About Technical Analysis and Crypto Trading? Join Dypto Crypto
Bollinger Bands are just one piece of the technical analysis puzzle. If you found this guide helpful and want to deepen your understanding of crypto trading, there’s a complete education waiting for you.
Dypto Crypto offers comprehensive courses designed for traders at every level. Whether you’re just starting to understand charts or you’ve been trading for years and want to refine your edge, the curriculum covers everything you need. You’ll learn about chart patterns and candlestick analysis, momentum indicators and oscillators, volume analysis and order flow, risk management and trading psychology, and how to build complete trading systems that actually work.
With proper education and a structured approach, you can make informed decisions based on probability rather than guessing. Whether you’re looking to supplement income, build long-term wealth, or simply understand how markets actually move, Dypto provides the roadmap.
Ready to level up your trading game? Visit Dypto Crypto today and explore the course offerings. Your future trading self will appreciate the investment in real knowledge.
FAQs (Frequently Asked Questions)
Q: What is the best Bollinger Band setting for crypto trading?
A: The standard 20,20,2 setting (20-period moving average, 2 standard deviations) works well for most crypto traders across different timeframes. Some day traders use 10 or 15 periods for faster response on short timeframes, but avoid over-optimizing. Start standard, trade at least 50 setups, and only adjust if you have clear evidence that changes improve results.
Q: Can Bollinger Bands predict crypto market breakouts?
A: Bollinger Bands can identify when breakouts are likely (during squeezes when bands tighten) but cannot predict direction alone. The squeeze signals that volatility is compressed and a big move is coming. You need volume, momentum indicators, and trend context to determine which way the breakout will go. Combined properly, these tools offer high-probability breakout trades.
Q: Are Bollinger Bands useful for day trading crypto?
A: Yes, especially on 15-minute to 1-hour charts. Day traders use band squeezes for breakout trades, quick bounces off bands in ranging markets, and trend confirmation when price walks the bands. The key is using tight stops and taking profits quickly. Bollinger Bands provide clear entry and exit reference points that work well for intraday timeframes.
Q: What’s the difference between Bollinger Bands and Keltner Channels?
A: Both create envelope indicators around price, but they calculate differently. Bollinger Bands use standard deviation (volatility-based), while Keltner Channels use Average True Range (ATR-based). This means Bollinger Bands are more sensitive to price changes and adjust faster to volatility spikes. For crypto’s extreme volatility, Bollinger Bands often work better since they adapt quickly.
Q: Do Bollinger Bands work for day trading crypto?A: Yes, they’re particularly effective for day trading when combined with volume and momentum confirmation. Use shorter timeframes (5-min to 1-hour) and focus on scalping band rejections, trading squeezes that resolve intraday, and bounces in ranging conditions. Day trading requires discipline and quick execution, so always use tight stops. Transaction fees add up with frequent trading, so factor costs into your profit calculations.
Disclaimer
This article is for educational and information purposes, and should not be considered financial advice. For more information visit our disclaimer page
About the Author