The Relative Strength Index (RSI) is one of the most powerful yet simple tools in a crypto trader’s arsenal. This momentum indicator helps you identify when a cryptocurrency might be overbought or oversold, giving you an edge in timing your trades.
What RSI measures: RSI tracks price momentum on a scale of 0-100, showing whether buying or selling pressure is dominating the market.
How to read it: Values above 70 typically signal overbought conditions (potential sell opportunity), while readings below 30 indicate oversold conditions (potential buy opportunity).
Practical applications: Learn to spot trend reversals, confirm breakouts, and identify divergences that signal upcoming price movements.
Real trading strategies: We’ll show you how to combine RSI with other indicators, set optimal timeframes for crypto’s volatile markets, and avoid common mistakes that trap beginners.
Whether you’re day trading or swing trading, mastering RSI can dramatically improve your entry and exit timing, helping you catch profitable moves while avoiding false signals in crypto’s 24/7 markets.
What is RSI (Relative Strength Index)?
The Relative Strength Index is a momentum oscillator that measures the speed and magnitude of price movements. Created by J. Welles Wilder Jr. in 1978, it is one of the most widely used indicators in crypto trading.
- Operates on a 0–100 scale, showing whether an asset is gaining or losing momentum.
- Despite its name, RSI does not compare strength between different assets. Only an asset’s current price relative to its own recent performance.
- Acts as a momentum gauge, indicating whether buying or selling pressure is increasing or fading.
- Used primarily to identify potential reversal points when price momentum becomes overextended.
- Extreme RSI levels suggest that a trend may be exhausted and due for a correction.
- Helps traders spot divergences, when price makes new highs/lows but RSI doesn’t—which can signal weakening momentum and possible trend reversals.
Understanding How RSI Indicator Works
RSI calculates momentum by comparing recent gains to recent losses over a specified period. The standard setting is 14 periods, whether hours, days, or weeks depends on your timeframe.
The calculation measures average gain and average loss over 14 periods, then divides average gains by average losses to get relative strength. This value is converted into an index between 0 and 100 using the formula: RSI = 100 – (100 / (1 + RS)). When gains dominate losses, RSI rises toward 100. When losses dominate, RSI falls toward 0.
What makes RSI useful is how it normalizes momentum data. A 5% move might be normal for Bitcoin but extreme for a stablecoin. RSI accounts for this by measuring each asset against its own recent behavior, making it applicable across all crypto assets.
The 14-period default works well for most trading, but it’s adjustable. Shorter periods like 7 make RSI more sensitive, generating more signals but also more false alarms. Longer periods like 21 smooth out noise but react more slowly. Most crypto traders stick with 14.
How to Read the RSI Chart
Reading an RSI chart is straightforward. The RSI appears as a single line oscillating between 0 and 100, typically displayed below your main price chart.
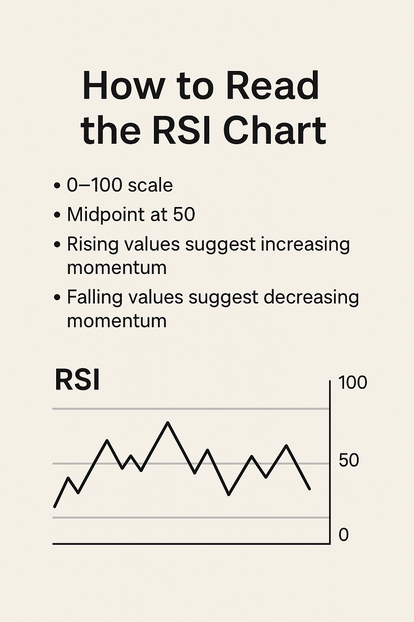
The most important level is 50, the midpoint. When RSI is above 50, buying pressure exceeds selling pressure. When RSI falls below 50, bearish momentum dominates. Two other critical levels are 70 and 30. RSI above 70 marks overbought territory, potentially vulnerable to pullback. RSI below 30 indicates oversold conditions, possibly due for a bounce.
The direction and slope of RSI matter as much as the absolute level. A sharply rising RSI shows strengthening momentum. A falling RSI indicates weakening momentum. The steeper the slope, the more dramatic the shift.
Setting up RSI is simple. On TradingView, click indicators, search “RSI,” and select “Relative Strength Index.” On Binance, open any chart, click “Indicators,” find RSI under “Momentum,” and add it. Default settings are 14 periods with 70/30 levels marked.
The key is understanding RSI shows momentum, not direction. RSI can stay overbought for weeks during bull runs or oversold through crashes. The levels tell you about momentum extremes, not guaranteed reversals.
Understanding Overbought and Oversold RSI Levels
Overbought and oversold conditions form the foundation of most RSI trading strategies. These zones indicate momentum extremes where price movements have potentially gone too far, too fast.
Overbought Conditions
• RSI enters overbought territory when it rises above 70, indicating strong and aggressive buying pressure.
• This shows the asset has gained strength quickly, and momentum may be overextended.
• Overbought ≠ sell immediately — in strong uptrends, RSI can stay above 70 for long periods.
• During major bull runs, assets like Bitcoin have held RSI >70 for weeks, meaning selling too early can cut off big gains.
• Treat overbought RSI as a caution signal, not a reversal guarantee.
• It suggests reduced reward for new long positions and signals to consider protecting existing profits.
• Some traders shift the overbought threshold to 80 during strong bullish trends to avoid premature exits.
• Context is crucial — in clear uptrends, overbought RSI is less concerning; in sideways or choppy markets, it becomes more meaningful.
• The real danger zone is RSI 85–90, where even powerful trends typically need to cool off because buying pressure becomes unsustainably high.
Oversold Conditions
RSI drops into oversold territory when it falls below 30, indicating dominant selling pressure and rapid strength loss.
Like overbought conditions, oversold doesn’t automatically mean “buy now.” During bear markets or crashes, RSI can stay oversold for extended periods as the asset grinds lower. Blindly buying every oversold signal is painful when the trend is firmly down.
Oversold RSI signals that selling pressure might be exhausting. In range-bound markets or uptrends, oversold RSI often provides excellent entry points. During extreme fear events, RSI can plunge to 10 or lower, marking short-term bottoms.
The 20 level serves as extreme oversold. When RSI drops below 20, a relief bounce becomes highly probable, even in downtrends.
Both overbought and oversold conditions work best when combined with other analysis. Confirm RSI signals with trend direction, support levels, volume, and market context.
How to Trade Crypto Using the RSI Indicator
Understanding RSI theory is one thing. Actually making profitable trades with it requires practical strategies. Here are five proven approaches to trading crypto using RSI.
1. Timing Entry and Exit Points
The simplest RSI strategy involves entering when RSI exits extreme zones. Instead of buying when RSI hits 30, wait for it to cross back above 30, confirming momentum is shifting. Instead of selling when RSI hits 70, wait for it to cross below 70, confirming the pullback has begun.
This reduces false signals. RSI can hover in oversold territory during crashes or stay overbought during rallies. Waiting for crossover confirmation helps avoid catching falling knives or selling too early.
For entries, watch for RSI crossing above 30 or 50. The 30 crossover signals the end of oversold conditions. The 50 crossover confirms the shift from bearish to bullish momentum. For exits, watch RSI crossing below 70 or 50.
Combine these crossovers with price action. If RSI crosses above 30 while price breaks resistance, that’s stronger confirmation than RSI alone.
2. Swing Trading with RSI
Swing traders use RSI to identify short- to medium-term reversal points. The strategy involves buying near oversold levels and selling near overbought levels within the larger trend.
In an uptrend, wait for pullbacks that push RSI into oversold territory, ideally below 30. When RSI turns back up, enter long positions, riding the swing to overbought levels. Exit when RSI reaches 70.
The key is respecting the larger trend. Don’t fight a strong uptrend by shorting every overbought reading. Trade with the trend, use RSI to time entries within it.
Set clear profit targets based on recent swing highs and lows. If buying an oversold bounce in an uptrend, target the previous swing high or where RSI last reached overbought.
3. Identifying Support and Resistance Zones
RSI often respects horizontal levels that align with price support and resistance. When RSI repeatedly bounces off a certain level, that level becomes significant.
Watch for RSI support levels where the indicator historically bounces. If RSI has bounced off 40 multiple times during an uptrend, when it approaches 40 again, it increases bounce probability.
Similarly, RSI resistance levels where the indicator repeatedly fails signal reversal zones. Combining RSI levels with price support and resistance creates powerful trade setups. If price tests major support while RSI tests its own support simultaneously, the confluence strengthens the case for a bounce.
4. Spotting Bullish and Bearish Divergences
• Divergences occur when price and RSI move in opposite directions, signaling weakening momentum.
• A divergence does not guarantee a reversal, but it often provides an early warning that the current trend may be losing strength.
Bullish Divergence
• A bullish divergence forms when price makes lower lows while RSI makes higher lows.
• This shows that although price is falling, selling momentum is fading, and bears are losing control.
• It often appears near the end of downtrends and can signal a potential reversal or a strong bounce.
• For example, on many Bitcoin corrections, price dips to a new low while RSI refuses to follow—often just before a recovery begins.
Bearish Divergence
• A bearish divergence forms when price makes higher highs but RSI makes lower highs.
• This means buying pressure is weakening, even though price continues to push upward.
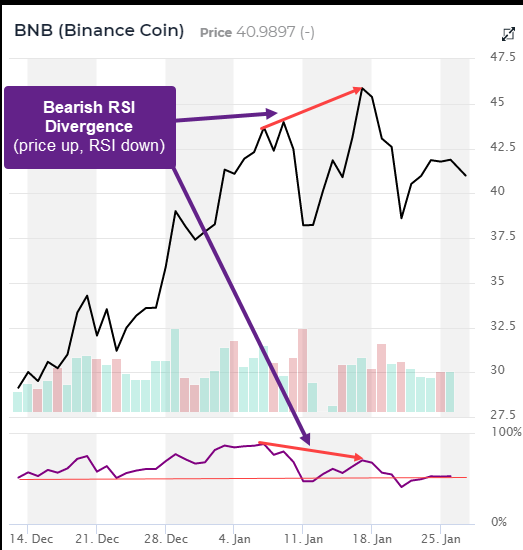
• It commonly appears during topping patterns or late-stage rallies when bullish momentum starts to fade.
• On crypto charts, assets like Ethereum or altcoins often make new highs during hype phases, but a lagging RSI exposes the weakening strength before the drop.
Why Divergence Matters
• Divergence helps traders detect momentum shifts early, before price fully reacts.
• Divergences are stronger when they occur near important RSI levels (30, 50, 70).
• They work best when combined with structure, trend, and volume—not used alone.
Examples from Live Crypto Charts
- According to CoinDCX, Bitcoin showed a bearish RSI divergence when price made higher highs while RSI formed lower highs.
- In a case study reported by Cryptohopper, Bitcoin’s daily chart illustrated a bullish divergence — price was falling (making lower lows), but RSI was rising (making higher lows), indicating weakening bearish momentum.
- On the AAX Academy blog, there’s another example of bearish divergence: price climbs, but RSI falls — warning that momentum may fade.
- In the Margex blog, they point to the 2021 Bitcoin peak, where price made a major high near $65K, but weekly RSI formed a lower high — a classic bearish divergence before a large correction.
5. Multi-Timeframe RSI Analysis
One of the biggest mistakes is analyzing RSI on only one timeframe. Multi-timeframe analysis dramatically improves signal quality and reduces false entries.
Check RSI on multiple timeframes before taking a trade. If trading on the 1-hour chart, also check the 4-hour and daily charts. If all timeframes align, showing similar RSI conditions, the signal is much stronger.
For example, if 1-hour RSI is oversold at 28, check higher timeframes. If 4-hour RSI is also oversold and daily RSI is approaching 40, all timeframes support a bullish bias. That’s a high-probability setup.
Use higher timeframes to determine bias and lower timeframes to time entries. The daily chart tells you the overall momentum environment. The 1-hour chart helps find precise entry points within that environment.
Combining the Relative Strength Index with Moving Averages
RSI becomes more powerful when combined with moving averages. While RSI measures momentum, moving averages identify trend direction. Together, they filter false signals and confirm high-probability trades.
The common approach pairs RSI with the 50 EMA or 200 EMA. The moving average shows the trend, if the price is above the 50 EMA, the trend is bullish. If below, it’s bearish. RSI then times entries and exits within that trend.
Here’s a practical strategy: only take long positions when price is above the 50 EMA and RSI crosses above 30 or 50. This ensures you’re buying in an uptrend when momentum shifts bullish. Avoid longs when price is below the 50 EMA, even if RSI shows oversold readings.
Moving average crossovers combined with RSI provide additional confirmation. When price crosses above the 50 EMA and RSI simultaneously crosses above 50, that’s a strong bullish signal.
The combination works especially well in trending markets. Moving averages keep you on the right side of the trend while RSI helps time entries when momentum aligns.
Here is an example:
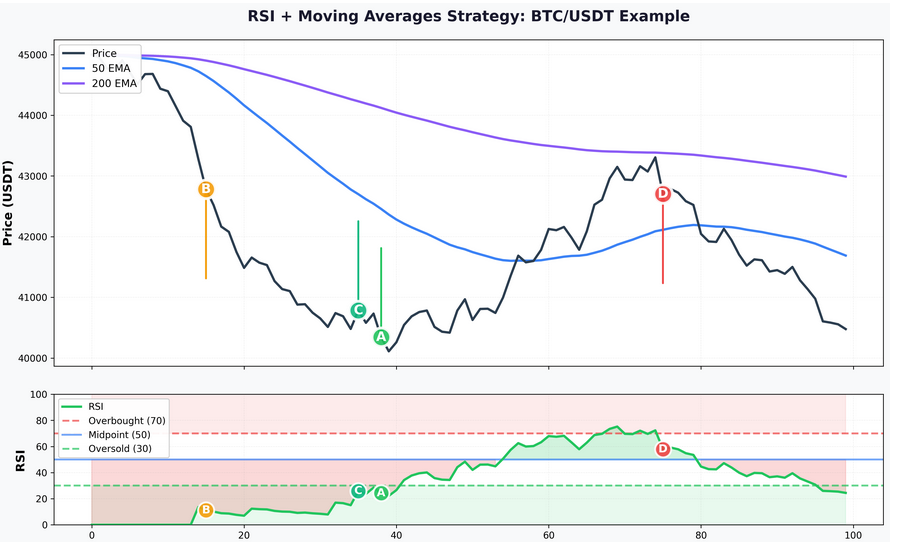
What the chart shows:
Black line: BTC/USDT price action
Blue line: 50 EMA (short-term trend indicator)
Purple line: 200 EMA (long-term trend indicator)
Colored markers: Four critical trading signals (A, B, C, D)
Middle Panel – RSI Indicator:
- Green line: RSI oscillating between 0-100
- Dashed lines: Key levels at 70 (overbought), 50 (midpoint), and 30 (oversold)
- Shaded areas: Red zone (overbought >70), Green zone (oversold <30)
- Same markers: Corresponding RSI values at each signal point
Bottom Panel – Signal Explanations:
A (Green) – BUY Signal:
- Price above 50 EMA + RSI crosses above 50
- Confirms uptrend with bullish momentum
B (Orange) – AVOID Trade:
- RSI oversold BUT price below 50 EMA
- The downtrend is still active – this is a false signal!
C (Bright Green) – STRONG BUY:
- Price crosses above 50 EMA + RSI above 30
- Trend reversal confirmed with momentum recovery
D (Red) – EXIT Signal:
- Price falls below 50 EMA + RSI drops below 50
- Trend shifts to bearish – time to exit
The chart clearly demonstrates why combining RSI with moving averages filters out false signals and keeps traders aligned with the dominant trend.
Key Considerations When Using the RSI Index
RSI is powerful, but like any indicator, it has limitations. Understanding these helps you use RSI effectively and avoid common mistakes.
• Never rely on RSI alone; always combine it with trend analysis, support/resistance, volume, and overall market context.
• RSI can stay overbought or oversold for long periods during strong trends, so acting on extremes too early can be costly.
• Timeframe is critical: short timeframes (like 5-minute charts) show very short-term momentum, while daily charts reflect longer-term movements.
• Match your RSI timeframe to your trading style and strategy.
• Crypto volatility affects RSI reliability — sudden news or manipulation can cause temporary extreme readings.
• In highly volatile markets, wait for RSI signals to stabilize before acting.
• False signals are common with any indicator; protect yourself with stop-losses, proper position sizing, and realistic expectations.
Summing it Up
The Relative Strength Index stands as one of crypto trading’s most valuable tools. It reveals momentum, spots exhaustion before reversals, and identifies divergences that precede major moves. From timing swing entries to confirming trend strength, RSI provides insights that improve trading decisions.
But RSI’s power comes from proper application. Understand what it measures, momentum relative to recent history. Respect the difference between momentum extremes and guaranteed reversals. Combine RSI with trend analysis, support and resistance, and volume to build complete trade setups.
The strategies we’ve covered give you concrete ways to apply RSI in real trading. Start with one approach, master it through practice, then gradually incorporate others as your skill grows.
Ready to level up your crypto trading? Dypto Crypto offers comprehensive courses on technical indicators, chart patterns, and complete trading strategies. Our expert-led content breaks down complex concepts into practical knowledge. Visit Dypto Crypto today and start trading smarter.
FAQs (Frequently Asked Questions)
Q: What is a good RSI level for buying crypto?
A: There’s no universally “good” RSI level for buying, it depends entirely on market context. In strong uptrends, buying when RSI pulls back to 40-50 often works well. In range-bound markets, waiting for RSI below 30 and then crossing back above 30 provides better entries. For long-term accumulation, RSI below 30 on weekly or monthly charts can signal attractive buying zones. The key is combining RSI levels with trend direction and support zones rather than using RSI alone.
Q: How do I know if a crypto asset is overbought or oversold using RSI?
A: RSI above 70 indicates overbought conditions, suggesting strong buying pressure that might be overextended. RSI below 30 signals oversold conditions, indicating intense selling pressure that could be exhausted. However, these levels aren’t absolute. In strong bull markets, assets can remain overbought (RSI above 70) for weeks. In bear markets, they can stay oversold (below 30) for extended periods. Always consider the broader trend and market context when interpreting overbought or oversold readings.
Q: Can RSI be used for long-term crypto investing?
A: Absolutely. While RSI is popular among day traders and swing traders, it works effectively for long-term investing when used on higher timeframes. Check weekly or monthly RSI to identify major accumulation or distribution zones. RSI below 30 on weekly charts often marks significant bottoms for long-term entries. RSI above 70 on monthly charts can signal when to reduce exposure or take profits. Long-term investors should use RSI to time entries and exits within their holding strategy, not as a reason to constantly trade.
Q: What’s the difference between RSI and Stochastic RSI?
A: RSI measures momentum by comparing recent gains to losses. Stochastic RSI, or StochRSI, is an indicator of an indicator, it applies the Stochastic formula to RSI values rather than price. StochRSI is more sensitive and oscillates more rapidly than standard RSI, ranging between 0 and 1. It generates more signals but also more false signals. RSI is generally better for identifying major momentum shifts and divergences. StochRSI works well for finding short-term overbought and oversold extremes within trends. Many traders use both, RSI for bigger picture momentum and StochRSI for precise entry timing.
Q: How accurate is RSI in predicting crypto market moves?
A: RSI doesn’t predict moves, it measures momentum and identifies potential reversal conditions. Its accuracy depends entirely on how you use it. Used alone, RSI generates many false signals, especially in trending markets where it stays extreme for extended periods. Combined with trend analysis, support and resistance, volume, and proper risk management, RSI significantly improves trading accuracy. Studies show RSI-based strategies can have 55-65% win rates when properly applied with confirmation from other indicators. The key is treating RSI as one tool in a complete trading system, not as a standalone prediction tool.
Disclaimer
This article is for educational and information purposes, and should not be considered financial advice. For more information visit our disclaimer page
About the Author