In the fast-moving world of cryptocurrency and foreign exchange, traders are constantly seeking an edge. Something that cuts through the noise and reveals what is really happening beneath the surface. SMT divergence (Smart Money Technique divergence) is one such tool. Put simply, it compares the price action of two correlated assets, such as Bitcoin and Ethereum, or EUR/USD and GBP/USD, to identify when one makes a new high or low while the other fails to follow. This mismatch is more than a quirk; it often reflects institutional “smart money” activity, indicating where strength or weakness lies.
What makes SMT divergence so compelling is that it exposes signals that traditional indicators often miss. While moving averages or oscillators may lag, SMT divergence highlights hidden reversals, liquidity grabs, and false breakouts in real time. That is why it is gaining popularity among smart money traders. It doesn’t just show you the chart; it shows you the intent behind the move. For traders who want to align with institutional flows rather than chase retail traps, SMT divergence offers a sharper lens into market behavior.
What Is SMT (Smart Money Technique) Divergence?
SMT Divergence is a technical analysis concept that examines the price action of correlated assets (e.g., two major currency pairs such as EUR/USD and GBP/USD, or two stock indices such as the S&P 500 and the Nasdaq).
- The idea is that when assets are highly correlated, they tend to move in the same direction.
- If one asset makes a higher high while the other fails to do so (or makes a lower high), this mismatch is called SMT divergence.
- It suggests that “smart money” (large institutional investors) may be favoring one asset over the other, revealing hidden strengths or weaknesses.
Traders monitor two or more related markets simultaneously. Suppose one market shows bullish strength (breaking higher) while the other lags or even drops; that’s a signal. The lagging asset may reflect underlying sentiment, whereas the stronger move could be a false push (often a liquidity grab preceding a reversal).
EUR/USD and GBP/USD often move together. If EUR/USD makes a new high but GBP/USD fails to follow, this divergence may indicate that EUR/USD’s rally is weak and could reverse soon. Smart money might be distributing positions in EUR/USD while quietly favoring GBP/USD.
SMT divergence is valuable because;
- Reveals hidden strength/weakness: Divergence shows what retail traders might miss by looking at one chart alone.
- Identifies potential reversals: Often occurs near market turning points, signaling exhaustion in one asset.
- Tracks smart money activity: Institutions may push one market to lure liquidity while positioning in another. SMT divergence helps traders spot this behavior.
- Risk management tool: Provides confirmation or caution before entering trades.
SMT divergence is essentially a cross-market comparison tool. By watching how correlated assets behave differently, traders can detect when price moves are deceptive and anticipate where smart money is truly flowing.
The Smart Money Logic Behind SMT Divergence
Institutional traders (often referred to as smart money) have the capital and patience to move markets strategically. They don’t chase price like retail traders; instead, they:
- Engineer liquidity events: Push price into areas where retail traders place stop-losses or breakout orders.
- Exploit correlations: Use multiple related assets (such as EUR/USD vs. GBP/USD or S&P 500 vs. Nasdaq) to obscure their true positioning.
- Leave footprints: Divergences between correlated assets often reveal where smart money is accumulating or distributing positions.
Retail traders assume correlated assets will move in sync. If EUR/USD breaks out to the upside, they expect GBP/USD to follow. Institutions may deliberately push one asset higher to trigger retail breakout buying, while quietly selling into that strength. When one asset reaches a new high while the other fails to, it signals that the breakout may be a trap. The lagging asset often shows the real sentiment. In other words, SMT divergence is the “tell,” the mismatch that exposes smart money’s true intentions.
Smart money thrives on retail liquidity pockets:
- Stop hunts: Retail traders place stops above highs or below lows. Smart money pushes the price just far enough to trigger those stops.
- False breakouts: Retail piles in when one correlated asset breaks structure, but smart money uses that liquidity to enter in the opposite direction.
- Divergence clue: If only one asset breaks out while the other doesn’t confirm, it’s often smart money harvesting liquidity before reversing.
Divergences show when moves are engineered rather than organic. It often occurs right before major turning points, as smart money finishes accumulating or distributing. Instead of chasing the “loud” move, traders can align with the quieter asset that reflects true institutional positioning.
SMT divergence is essentially a window into smart money tactics. By comparing correlated assets, traders can identify when institutions exploit retail liquidity through false moves and position themselves ahead of the real trend.
How SMT Divergence Can Be Useful?
SMT divergence is valuable because it reveals when correlated assets disagree, thereby exposing hidden strengths or weaknesses. By using it to confirm setups, such as spotting reversals, avoiding fake breakouts, refining entries, and filtering noise, traders can trade with greater confidence and reduce the risk of being caught on the wrong side of smart money moves. Here is a clear, practical breakdown of how SMT Divergence can be useful in trading:
- Spotting Potential Reversals: Divergence between correlated assets often appears near turning points. If one asset makes a new high while the other fails, it can signal exhaustion in the move and hint at an upcoming reversal.
- Avoiding Fake Breakouts: Retail traders often become trapped in false breakouts engineered by professional traders. SMT divergence helps filter these traps: if only one correlated asset breaks structure while the other doesn’t confirm, the breakout is likely a liquidity grab rather than genuine strength.
- Sharpening Entry Timing Near Liquidity: Divergence often occurs around liquidity pools (stop-loss clusters or breakout levels). By waiting for SMT divergence to appear, traders can time entries more precisely, entering after liquidity has been taken but before the real move unfolds.
- Filtering Low-Quality Setups: Not every chart pattern or breakout is worth trading. SMT divergence acts as a filter: if correlated assets confirm each other, the setup is stronger; if they diverge, it warns that the move may lack conviction.
SMT divergence is not a standalone signal. It works best as a confirmation tool alongside other elements of a trading plan, such as market structure, liquidity zones, or higher-timeframe bias. Think of it as a secondary lens: it doesn’t replace your strategy, but it sharpens your view of whether a move is genuine or deceptive. When used correctly, it helps traders align with smart money activity instead of chasing retail traps.
Bearish and Bullish SMT Divergence
SMT divergence comes in two forms: bullish and bearish. Both occur when correlated assets exhibit different behavior at key price levels. These mismatches provide traders with clues about potential trend reversals or continuations, often revealing smart money activity beneath the surface.
Bullish SMT Divergence
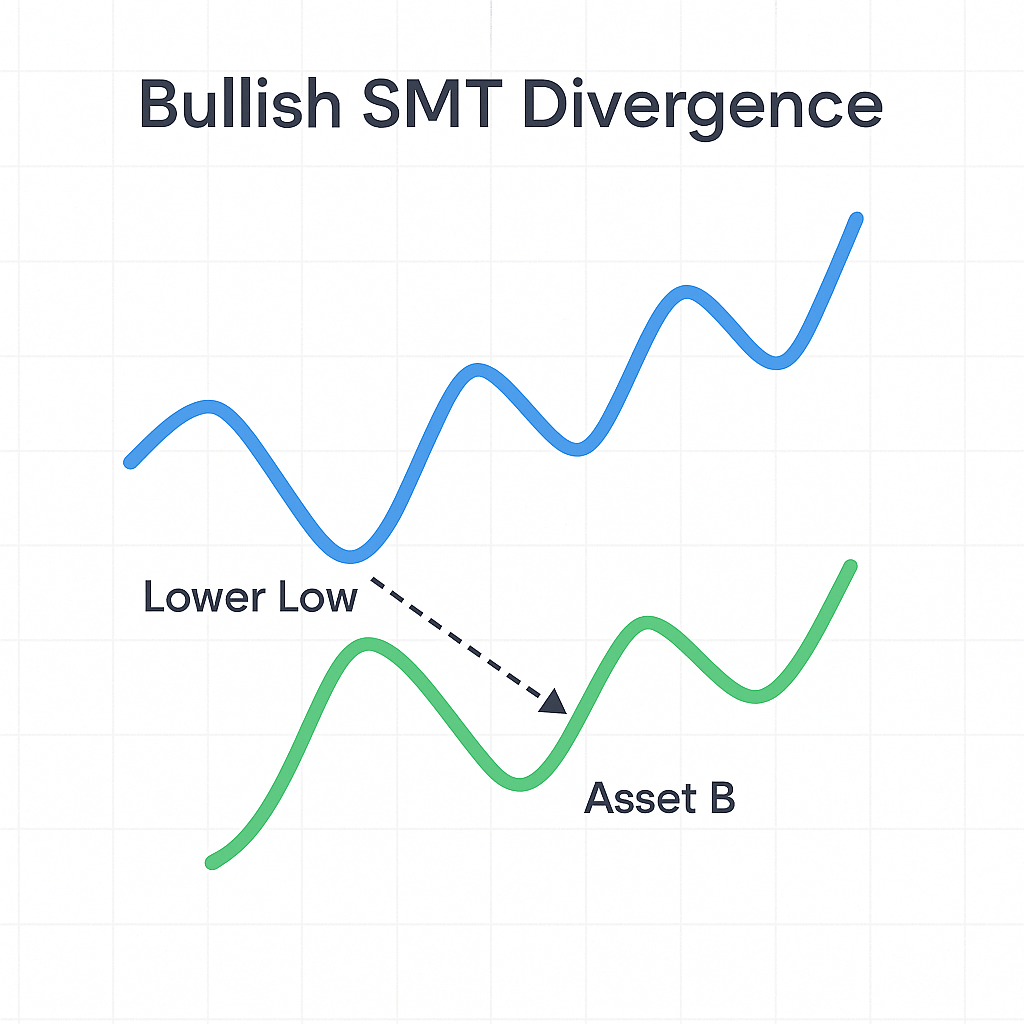
Bullish SMT divergence happens when one correlated asset makes a lower low, but the other fails to make a lower low.
- Interpretation: This signals that selling pressure is weakening. While one market appears to be breaking down, the other is resisting, suggesting institutional investors may be accumulating positions.
- Trading Insight: It often signals the end of a bearish move and can present an opportunity to go long, anticipating an upward reversal.
Bearish SMT Divergence
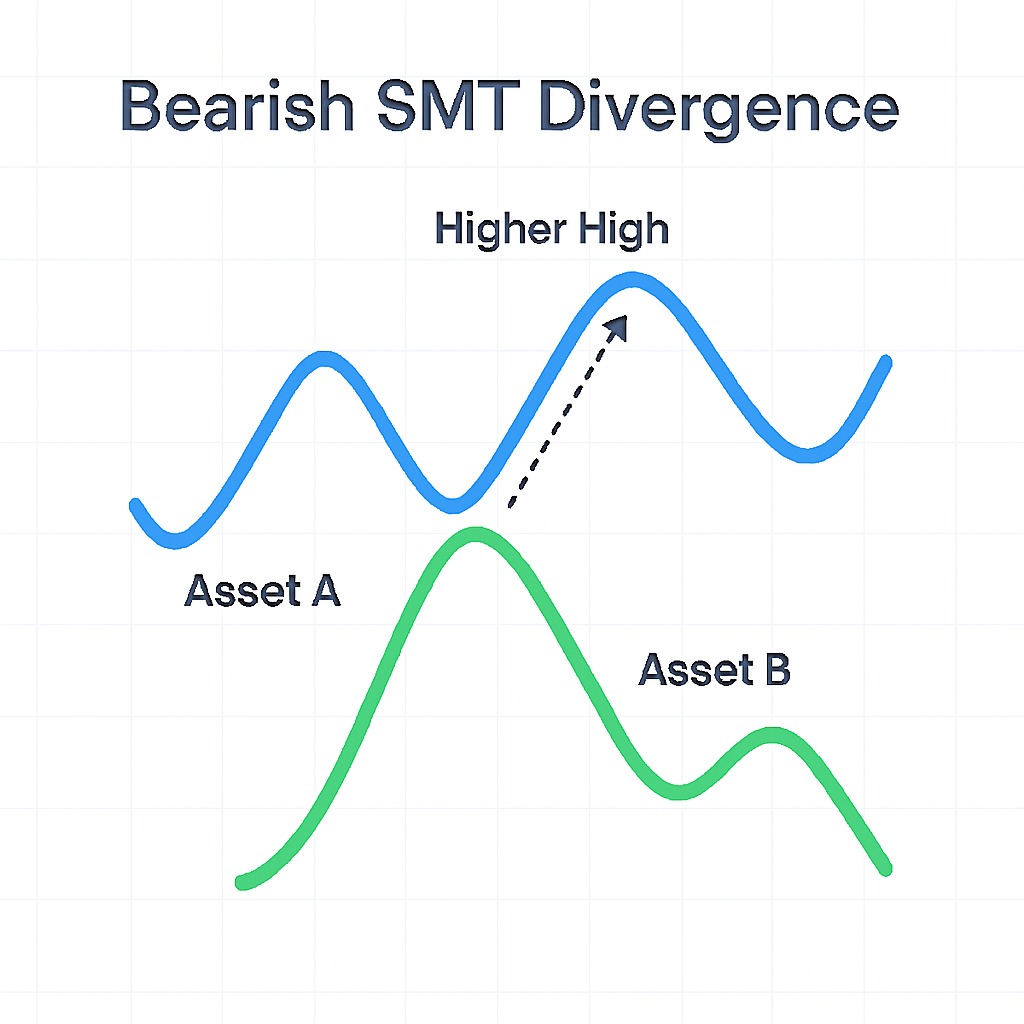
Bearish SMT divergence occurs when one asset makes a higher high, but the correlated asset fails to make a higher high.
- Interpretation: This shows weakening buying pressure. While one market appears to break out, the other lags, suggesting that smart money may be distributing positions.
- Trading Insight: It often signals the end of a bullish move and can present an opportunity to short, anticipating a downward reversal.
How to Identify SMT Divergence on Your Charts
- Pick correlated markets: Choose two assets with strong historical correlation (e.g., EUR/USD vs GBP/USD, S&P 500 vs Nasdaq, WTI vs Brent). Use the same timeframe for both charts to avoid mixed signals.
- Define your bias and timeframe: Align with a higher timeframe (daily/4H) and execute at a lower timeframe (1H/15m) for precision. Know whether you’re hunting for a reversal or continuation before scanning.
- Mark the recent swing highs/lows: Identify the most recent structural highs and lows for both assets. Draw levels and note equal highs/lows, as these often house liquidity pools (stop clusters, breakout orders).
- Locate key liquidity areas: Highlight zones immediately above prior highs and immediately below prior lows where stops are likely placed. Observe how price behaves as it approaches, touches, or runs through these levels.
- Compare the break or failure. Look for a mismatch: In Bearish SMT, one asset makes a higher high into liquidity, while the other fails to make a higher high. In a Bullish SMT, one asset makes a lower low into liquidity, while the other fails to make a lower low. This disagreement in a liquidity area is your SMT signal, as it hints at hidden strengths and weaknesses.
- Confirm with structure and timing: Wait for a shift in market structure (e.g., a break in a minor swing) in the asset that drives liquidity. Look for rejection wicks, volume fade, or momentum divergence to strengthen the read.
- Plan the entry and risk: Enter on the retest of the broken level or after a clean rejection near liquidity. Place stops beyond the liquidity sweep; target the opposing side of the range or next structural level.
How to Trade Around SMT Divergence
Trading around SMT divergence requires a structured, disciplined approach that blends technical precision with smart money logic. SMT divergence is not a standalone signal; it is a confirmation tool that helps traders align with institutional behavior by comparing price action across correlated assets.
To use it effectively, traders must follow a step-by-step process: select appropriate markets, identify liquidity zones, spot divergences, confirm structures, and execute with clear risk and reward parameters. This method helps filter out noise, avoid retail traps, and enter trades with greater confidence and timing. Below is a breakdown of each step in the process.
Pick the Right Correlated Markets
The foundation of SMT divergence is correlation. Traders must choose asset pairs that typically move together, such as BTC and ETH, or major altcoin pairs like SOL and AVAX. These assets often share macro drivers, investor sentiment, and liquidity flows, making them ideal for divergence analysis. If one asset breaks a key level while the other fails to follow, it can reveal hidden strength or weakness. However, using poorly correlated pairs can lead to false signals and confusion.
Always verify historical correlations for the chosen timeframe before applying SMT logic. A strong correlation ensures that any divergence is meaningful rather than random noise.
Set Your Timeframe
Selecting the timeframe is critical when trading SMT divergence. Your chosen timeframe should align with your trading style: swing traders typically use higher timeframes such as 4H or daily, whereas intraday traders focus on 15m or 1H charts. The divergence signal must be visible and actionable within your execution window.
For example, a 4H divergence may take hours to play out, while a 15m divergence could resolve within minutes. Also, ensure that both correlated assets are analyzed on the same time frame to maintain consistency. Mixing timeframes can distort the signal and lead to poor decisions. Clear timeframe alignment helps you stay focused and avoid chasing setups.
Mark the Key Liquidity Levels
Before identifying divergence, traders must identify key liquidity zones, areas where stop-losses and breakout orders are likely to cluster. These include recent swing highs and lows, equal highs/lows, and obvious structural levels. Smart money often targets these zones to trigger retail orders and create false moves.
Use horizontal lines or zones to mark these areas on both correlated charts. Pay special attention to levels that have been tested multiple times or sit near psychological price points. These are prime candidates for liquidity sweeps. SMT divergence often forms when one asset taps or runs liquidity while the other holds back, revealing the trap.
Spot the SMT Divergence
With liquidity zones marked, the next step is to watch for divergence. This occurs when one correlated asset reaches a new high or low within a liquidity zone, while the other does not. For example, if BTC makes a higher high above resistance but ETH does not, that’s bearish SMT divergence. Conversely, if ETH makes a lower low but BTC holds above its previous low, that’s bullish SMT divergence.
This mismatch signals that the breakout or breakdown may be engineered to harvest liquidity. The asset that fails to confirm often reflects smart money’s true positioning, making it the better trade candidate.
Confirm Market Structure
Spotting divergence is not sufficient; you must confirm that the market structure supports a potential reversal. Look for a Break of Structure (BOS) or Change of Character (CHoCH) on the asset that ran liquidity. A BOS occurs when price breaks a key swing level in the opposite direction of the sweep, while a CHoCH signals a shift in control from buyers to sellers (or vice versa).
These structural shifts validate the divergence and indicate that smart money may be reversing the move. Without structure confirmation, divergence alone can be misleading. Always wait for the price to show intent before planning your trade.
Wait for Entry Confirmation
Patience is key when trading SMT divergence. After spotting divergence and confirming structure, wait for clear entry signals. These may include a BOS retest, a Fair Value Gap (FVG) fill, or a strong-displacement candle indicating institutional momentum. These signals confirm that smart money is active and the reversal is underway.
Avoid jumping in immediately after the divergence forms. Wait for the price to reject the sweep and show commitment. Entry confirmation reduces false positives and improves timing. It also helps you avoid emotional decisions and stay on course with your plan. Let the market prove itself before you commit capital.
Define Invalidation + Stop Loss
Every trade needs a clear invalidation point. In SMT divergence setups, the best stop-loss placement is just beyond the liquidity sweep or the nearest swing point. This ensures that if smart money continues pushing the price, you’re out quickly with minimal damage. Avoid emotional stop placement, and don’t widen your stop just to stay in the trade.
Use structure to define risk logically. If price breaks beyond the sweep and fails to reverse, the divergence is invalid. Accept the loss and move on. A well-placed stop protects your capital and preserves your edge. Risk management is non-negotiable in smart money trading.
Set Targets Using Liquidity
Smart money trades toward liquidity. Your profit targets should reflect this logic. Look for external liquidity pools, such as prior swing highs/lows, untapped FVGs, or inefficiencies left by impulsive moves. These areas attract price and offer logical exit points. Avoid vague targets like “2R” or “next resistance” without context. Use the same liquidity logic that guided your entry to define your exit.
This keeps your trade aligned with institutional behavior and improves precision. Targeting liquidity also helps you avoid premature exits and maximize reward. Let the price reach the next pool before you close the trade.
Post-Trade Review
After the trade, take time to reflect. Review your setup, entry confirmation, stop placement, and target execution. Did the divergence form at a valid liquidity zone? Was the structure confirmed before entry? Did the price respect your invalidation level? These questions help you build a feedback loop and sharpen your edge.
Document your trades with screenshots and notes. Over time, you will spot patterns and refine your process. SMT divergence is a nuanced tool that rewards traders who learn from experience. Post-trade review turns every setup into a learning opportunity and helps you become a more confident, consistent trader.
Tools to Assist You in SMT Divergence Analysis
SMT divergence is about comparing correlated assets and identifying mismatches in liquidity levels. To make this process more efficient and precise, traders can rely on a combination of charting platforms, indicators, and analytical tools. Here are some of the most useful ones:
Charting Platforms
- TradingView / MetaTrader / NinjaTrader: These platforms allow you to plot multiple correlated assets side by side or even overlay them on the same chart. This makes it easier to visually spot divergences between swing highs and lows.
- Benefit: Clear visualization of price action across assets in real time.
Correlation Tools
- Correlation Coefficient Indicators: These indicators measure the degree of correlation between two assets (e.g., BTC vs ETH). A strong correlation (close to +1) means SMT divergence signals are more reliable.
- Benefit: Helps confirm whether the assets you’re analyzing are truly moving together before applying SMT logic.
Liquidity Mapping Tools
- Liquidity Heatmaps / Order Book Tools (e.g., Bookmap): These tools show the locations of stop-loss clusters and pending orders. Since SMT divergence often forms around liquidity pools, heatmaps can highlight the zones smart money is likely targeting.
- Benefit: Pinpoints liquidity areas where divergence setups are most probable.
Market Structure Indicators
- Break of Structure (BOS) / Change of Character (CHoCH) Indicators: Custom indicators or manual marking of BOS/CHoCH help confirm whether divergence is leading to a genuine reversal.
- Benefit: Adds structure-based confirmation to divergence signals.
Multi-Timeframe Analysis Tools
- MTF Indicators/Dashboard Tools: These enable simultaneous tracking of divergences across multiple timeframes. For example, spotting SMT divergence on the 15m chart while confirming bias on the 4H chart.
- Benefit: Ensures alignment between short-term signals and higher-timeframe context.
Journaling & Review Tools
- Trading Journals (Notion, Edgewonk, Excel): Recording SMT divergence setups, entries, and outcomes helps refine your edge. Over time, you will see which correlations and liquidity zones produce the most reliable signals.
- Benefit: Builds a feedback loop to sharpen your divergence analysis.
Risk Management Rules for Trading SMT Divergence
Trading SMT divergence can be powerful, but without disciplined risk management, it quickly becomes dangerous. The goal is not to win every trade; it is to preserve capital and remain consistent enough to capture high-probability setups when they appear. Here are practical principles tailored to SMT setups:
- Position Sizing: Always size positions based on a fixed percentage of your account (commonly 1–2% risk per trade). SMT divergence often appears near liquidity sweeps, which can be volatile zones. Smaller, controlled sizing helps you stay focused amid the noise. Avoid “all-in” trades, as smart money thrives on shaking out overexposed retail traders.
- Risk-to-Reward Ratios: Aim for a minimum 1:2 or 1:3 risk-to-reward ratio. SMT setups are designed to catch reversals at liquidity points, meaning the potential reward is often much larger than the risk. If the setup doesn’t offer at least 2x your risk, skip it, as capital preservation is more important than forcing trades.
- Avoid Overleveraging: Leverage magnifies both gains and losses. In SMT setups, where liquidity sweeps can spike prices, overleveraging is especially dangerous. Stick to conservative leverage (or none at all) to avoid being liquidated by short-term volatility. Remember: smart money hunts leveraged retail positions first.
- Only Trade Confirmed Signals: SMT divergence alone is not enough; always wait for confirmation. Look for Break of Structure (BOS), Change of Character (CHoCH), or displacement candles after divergence forms. Enter only when the market proves smart money is active. This filters out false signals and reduces unnecessary losses.
- Capital Preservation Over Frequent Wins: The edge in SMT setups comes from quality, not quantity. It is better to take fewer, high-probability trades than to chase every divergence. Protecting capital ensures you’re still in the game when the cleanest setups appear.
Risk management in SMT divergence trading is about discipline and patience. Size positions modestly, demand strong risk-to-reward, avoid leverage traps, and only trade confirmed signals. By prioritizing capital preservation over frequent gains, you align with smart-money logic: stay liquid, consistent, and ready to capitalize when the market reveals its true intentions.
Is SMT Divergence a Reliable Strategy for Crypto Traders?
SMT divergence can be a valuable tool for crypto traders, but its reliability depends heavily on context, discipline, and application. At its core, SMT divergence highlights mismatches between correlated assets (such as BTC and ETH) to reveal hidden strengths or weaknesses.
This can be especially powerful in crypto markets, which are highly liquidity-driven and often manipulated by larger players. However, it is not a magic bullet, as its effectiveness varies with market conditions, timeframe, and whether traders use it alongside other smart money concepts.
- Context Matters: SMT divergence is most reliable when it occurs at clear liquidity zones (swing highs/lows, equal highs/lows). Random divergences within a range are less meaningful.
- Timeframe Alignment: Signals on higher timeframes (4H, daily) tend to carry more weight than those on lower timeframes, which can produce noise. Intraday traders must be cautious about overinterpreting minor divergences.
- Market Conditions: In trending markets, divergences may fail as momentum overrides liquidity traps. They are more effective during ranging or transitional phases, when smart money is accumulating or distributing.
- Confirmation Signals: SMT divergence should never be traded in isolation. Look for Break of Structure (BOS), Change of Character (CHoCH), or displacement candles to confirm that professional investors are active.
Strengths
- Helps spot potential reversals before retail traders catch on.
- Filters out fake breakouts engineered to trap liquidity.
- Sharpens entry timing around liquidity sweeps.
- Provides insight into institutional behavior, aligning traders with the logic of smart money.
Limitations
- Not foolproof, as divergence can fail if correlation temporarily breaks down.
- Requires patience and confirmation; trading it blindly often leads to losses.
- Works best as part of a broader smart-money framework (liquidity, market structure, FVGs), rather than as a standalone system.
SMT divergence is reliable when used correctly in context, with proper timeframe alignment, and confirmed by structure. It’s a powerful lens into smart money activity, but it’s not infallible. Crypto traders should treat it as a confirmation tool within a broader smart-money strategy, prioritizing capital preservation and disciplined execution over chasing every divergence.
Join Dypto Crypto to Learn All About Crypto, Blockchain, and DeFi
Crypto, blockchain, and DeFi are evolving faster than ever, and staying ahead requires more than just surface-level knowledge. It demands structured learning, expert guidance, and a supportive community. That is exactly what Dypto Crypto offers.
By joining Dypto Crypto, you will gain access to expertly crafted courses and resources that simplify complex topics, including SMT divergence, liquidity concepts, and smart money strategies. More importantly, you will learn directly from experienced professionals and connect with a community of traders, builders, and enthusiasts who share your interest in Web3.
Take the next step in your crypto journey. Join Dypto Crypto today to learn from experts and build alongside a vibrant community.
Frequently Asked Questions
What does SMT divergence mean in crypto trading?
SMT divergence in crypto trading compares price action between correlated assets, like BTC and ETH. When one makes a new high or low while the other fails, it signals hidden strength or weakness. This mismatch often reveals smart money activity, helping traders anticipate reversals or avoid false breakouts.
How do you spot SMT divergence on a crypto chart?
To spot SMT divergence on a crypto chart, compare two correlated assets like BTC and ETH. Mark recent swing highs and lows, then check if one makes a new high or low while the other fails at a liquidity zone. This mismatch signals potential smart money activity.
Can SMT divergence help predict trend reversals in Bitcoin or Ethereum?
Yes, SMT divergence can help predict trend reversals in Bitcoin or Ethereum by comparing their price action. If one makes a new high or low while the other fails, it signals weakening momentum. Used with market structure and liquidity analysis, it reveals smart money’s intentions.
What are the best timeframes to trade SMT divergence?
The best timeframes to trade SMT divergence depend on your style. Swing traders often use higher timeframes like 4H or daily for stronger signals, while intraday traders focus on 15m or 1H charts for precision. Always align both correlated assets on the same timeframe for consistency.
Which charting tools support SMT divergence analysis?
Charting tools like TradingView, MetaTrader, and NinjaTrader support SMT divergence analysis by allowing side-by-side or overlay comparisons of correlated assets. Indicators such as correlation coefficients and liquidity mapping enhance accuracy. These platforms help traders identify misaligned highs or lows, confirm structure, and visualize smart-money footprints effectively.
Disclaimer
This article is for educational and information purposes, and should not be considered financial advice. For more information visit our disclaimer page
About the Author