We’ve all seen content online where traders see something happen on a chart and start freaking out. These crypto candle patterns make zero sense to the untrained eye (and sometimes even to intermediate traders). What’s the big deal? Why does this stuff matter?
The world of cryptocurrency is fast-paced, volatile, and thrilling. A little guidance goes a long way for traders trying to understand it all. The first step in being a successful trader is to know what to look for and what you’re looking at. Enter candlestick patterns, the visual clues that sometimes glimpse market sentiment. They aren’t fool-proof, and in crypto, nothing is guaranteed. But every piece of knowledge counts for something.
If you’re new to crypto trading or looking to sharpen your skills, understanding bullish candlestick patterns is necessary. These are the tools traders lean on to identify a possible bullish trend, which can help to guide entry and exit strategies effectively.
Let’s dive into bullish candlestick patterns, how they work, and, most importantly, how to use them to make informed trading decisions. Whether you’re here to decode the market or perfect your analysis skills, we’ve got you covered. Let’s get after it.
The Basics of a Candlestick Pattern
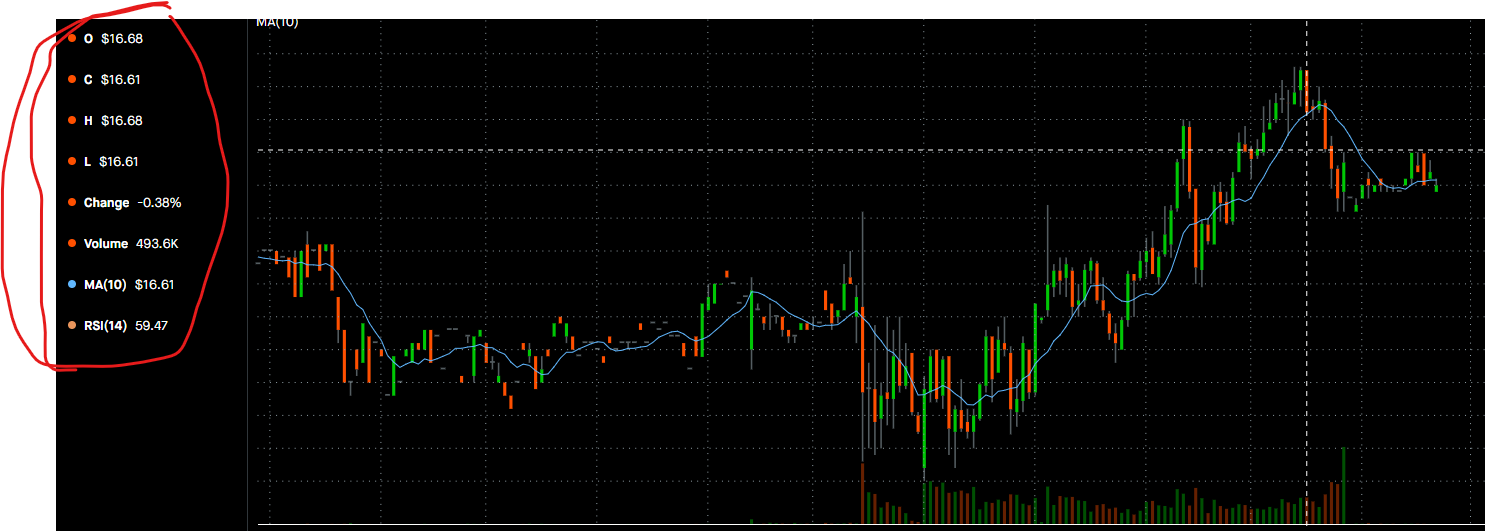
Before we proceed, let’s cover the essentials. Candlesticks are visual representations of price movements in the market, often used in technical analysis to understand and predict market behavior. Each candlestick represents a specific time frame and provides four key data points: the opening price, closing price, highest price, and lowest price during that period.
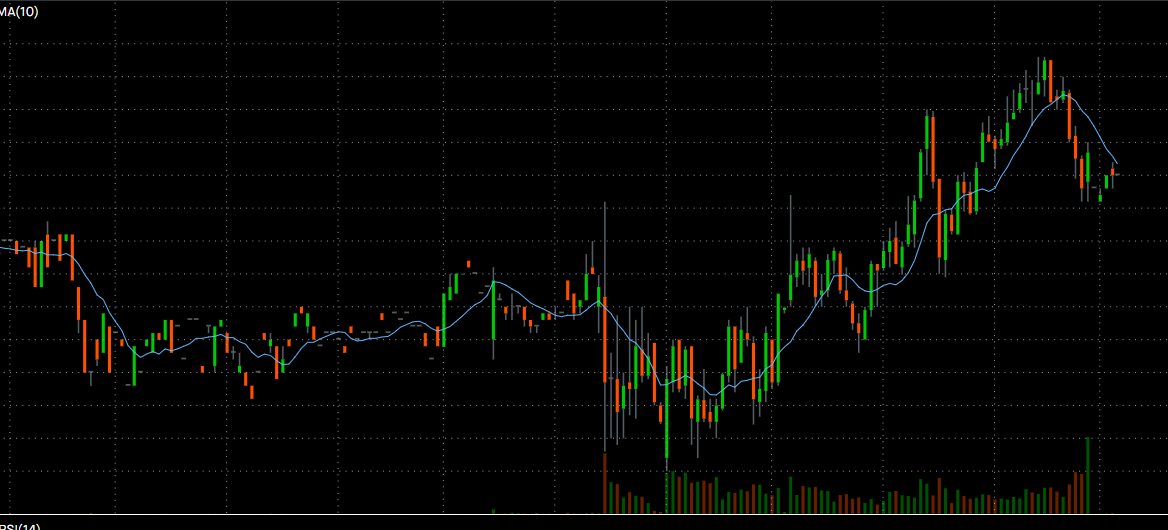
The candlestick’s body shows the difference between the opening and closing prices, while the wicks (or shadows) indicate the high and low points.
In this case, a green or candlestick signals a price increase, while an orange candlestick indicates a price decrease. However, different brokerages and trading platforms use different colors.
This simple yet powerful tool enables traders to assess market sentiment and trends quickly, making candlesticks an essential component of trading strategies.
So, what is a candlestick pattern? And are crypto candle patterns any different?
A candlestick pattern visually represents bullish crypto cycles and price movements within a specific timeframe. It is universal for all financial markets, at least…most of the time.
Candlestick patterns were originated in Japan centuries ago by a rice trader. They didn’t make their way to the United States until the 1990s. Now, they are one of the most popular methods traders use to analyze markets.
Our favorite market may be slightly different, but it’s still a financial one. So most of the same rules will still apply.
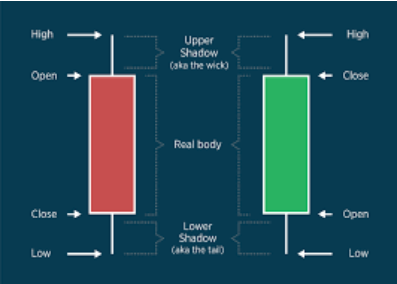
Each candlestick has three main components:
- The Body: The fat part of the candlestick, showing the opening and closing prices during the chosen timeframe.
- The Upper Wick (or Shadow): Indicates the highest price reached during the period.
- The Lower Wick (or Shadow): Represents the lowest price.
The color of the body (green for bullish, red for bearish) tells traders whether the price closed higher or lower than it opened. Most platforms will have this information included in their charts.
Take a look at this basic diagram below to get a better grasp of the key components.
Feeling more comfortable? That’s good. Understanding these basics is vital before proceeding to the specific candlestick patterns discussed below.
Top 8 Bullish Candlestick Patterns Explained With Charts
Bullish crypto patterns are like little “buy” signals embedded in a chart. While no crypto candle patterns can guarantee success, these eight formations have consistently helped traders predict upward trends.
It’s important to note that almost every trader knows and uses these patterns. So you won’t be doing anything that others aren’t. You won’t have an edge. But you’ll be on equal footing, at least to a degree.
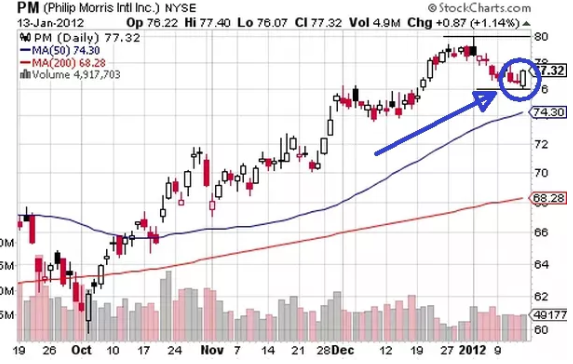
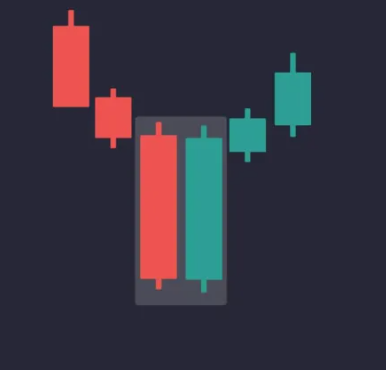
1. Bullish Engulfing
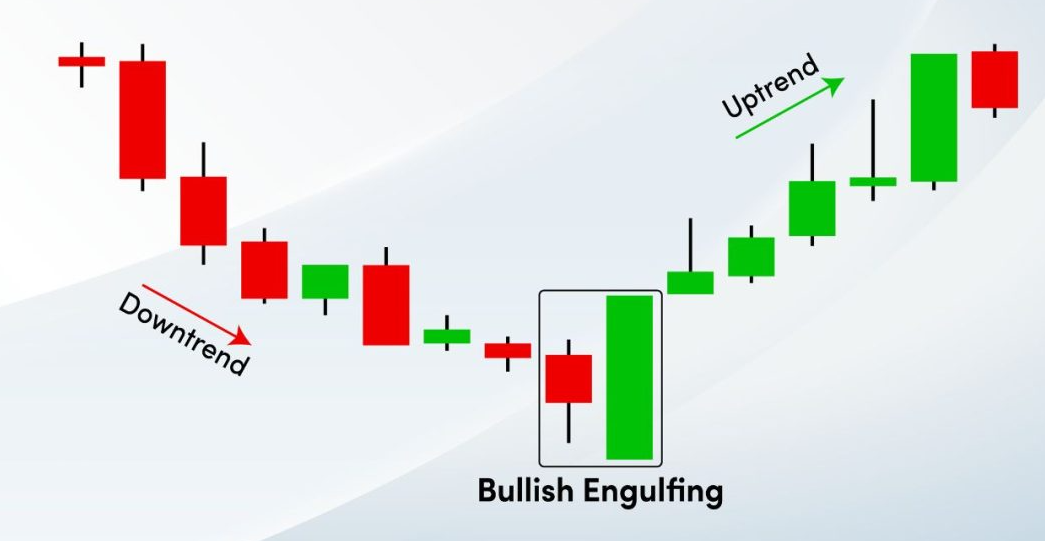
The Bullish Engulfing pattern is a bullish reversal candlestick pattern. It happens when a small bearish candle is followed by a larger bullish candle that completely engulfs it. This suggests a strong reversal and increasing buyer momentum.
This is one of our favorite bullish crypto patterns. It’s easy to understand and see within the pattern as it occurs.
Example:
- A real-world instance of this pattern occurred with Phillip Morris in 2012. The price peaked a bit, and it looked like the bears would take over. But then an engulfing pattern formed, the bulls saw it, and the uptrend continued.
2. Hammer
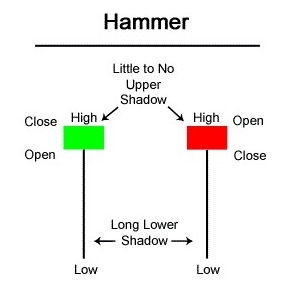
The Hammer forms when a candle has a small body and a long lower wick. It’s a really interesting pattern.
It shows traders that sellers pushed prices lower during a period. Keep in mind that users can set charts to different periods. So a wick can represent anything from a minute to four hours and anything in between.
In the example of a hammer for bullish crypto patterns, it tells us that by the end of the period represented by this candlestick, buyers could regain control, and that the candle closed higher.
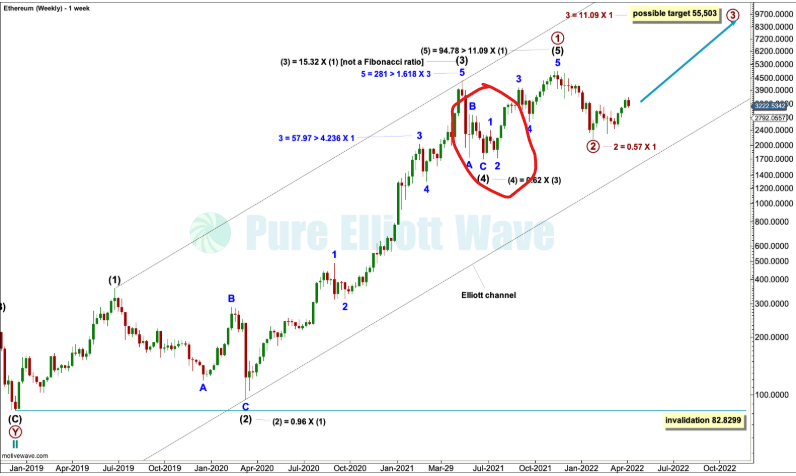
Example:
- Ethereum (ETH) traders might recall the iconic hammer that preceded its climb during the 2021 bull run. This is from a weekly chart. As you can see, price action decreased, but then the hammer pattern pushed the price up.
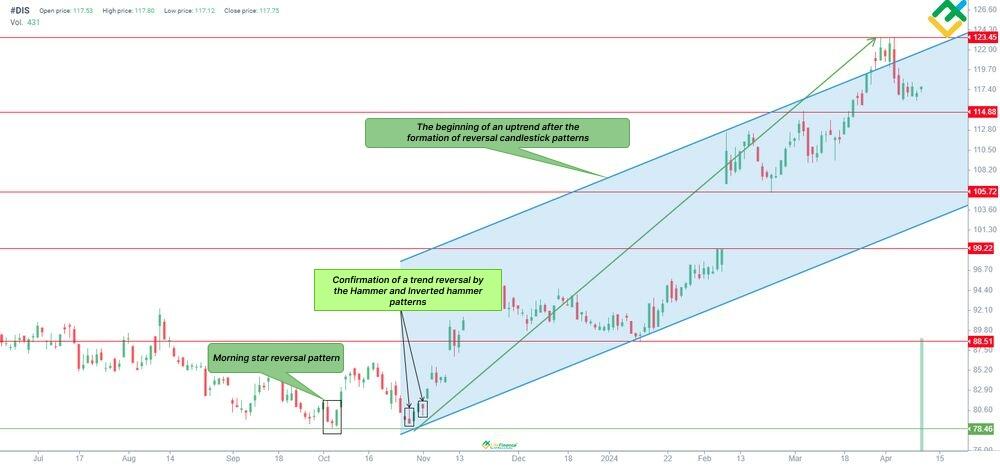
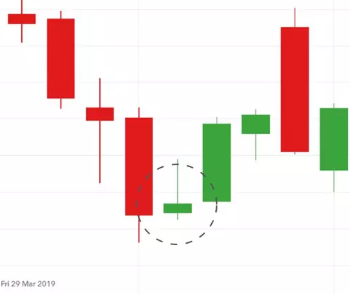
3. Morning Star
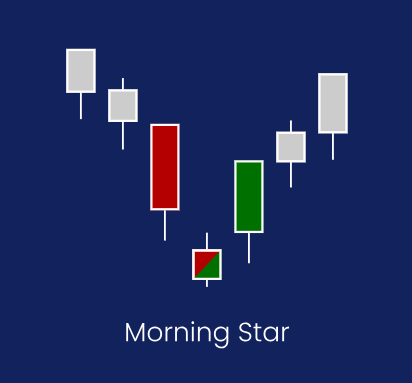
This three-candle formation is a favorite among traders looking for bullish patterns in crypto. A small-bodied candle (often red or neutral) sits between a long bearish candle and a bullish one. It signals that selling pressure is fading and a price increase is likely.
Example:
- Disney’s stock experienced this in late 2023 and early 2024. You can see where a small morning star formed, then two hammers, and then the stock exploded.
4. Piercing Line
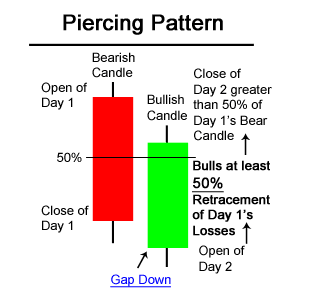
The Piercing Line forms across two candles. The first is bearish, and the second bullish candle opens with a gap down but rises to close above the midpoint of the first candle.
Example:
- Here’s a great example from the Forex market when the Pandemic hit. This is the gold/USD pair. When the world started to shut down, everything tanked. But gold, as we all know, is similar to Bitcoin in that it’s a hedge against inflation. The market crashed, but the piercing pattern shown was a sign of quick recovery. The bulls went wild, and you can see what happened after.

5. Inverted Hammer
The opposite of the Hammer, the Inverted Hammer has a small body and a long upper wick. It points to buyer momentum forming after a bearish trend. As a trader, you see a bearish trend. Then you see an inverted hammer form on something like a 15-minute chart. That means the bulls are starting to go to work.
Example:
- Here’s an example of some ETH bulls going on a buying spree when they see the inverted hammer appear.
6. Three White Soldiers
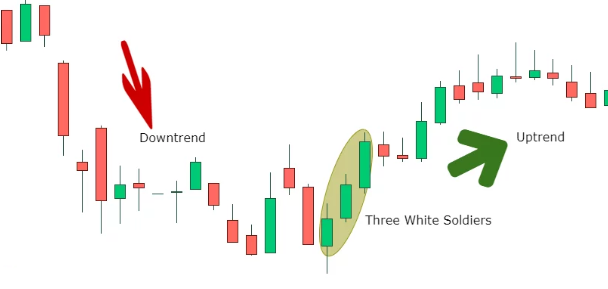
Three consecutive green candles with short or no wicks? That’s your Three White Soldiers. This is one of the best bullish candlestick patterns for traders looking for solid momentum.
Example:
- Here’s an example of an ETF from a few years back with some obvious TWS candlesticks. Many new traders see this pattern as an instant buy. Don’t let it fool you. Examples of fake outs have occurred, costing people a lot of money. Remember, every trader sees the same patterns as you. Some will buy, but others will do the opposite.
.
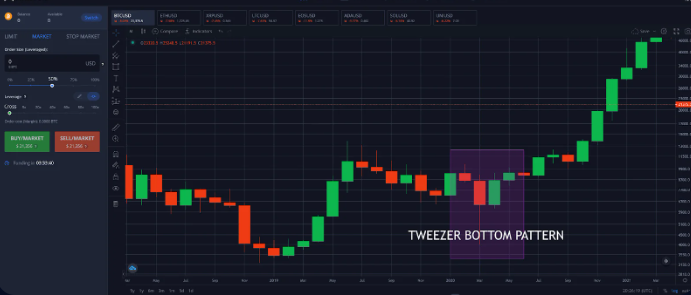
7. Tweezer Bottoms
The Tweezer Bottom pattern comprises two candles with the same low price. This suggests the market has found its support level. Some aggressive traders will snap buy this. More conservative traders will wait to see what unfolds as the session progresses. Look for an increase in volume before making a move.
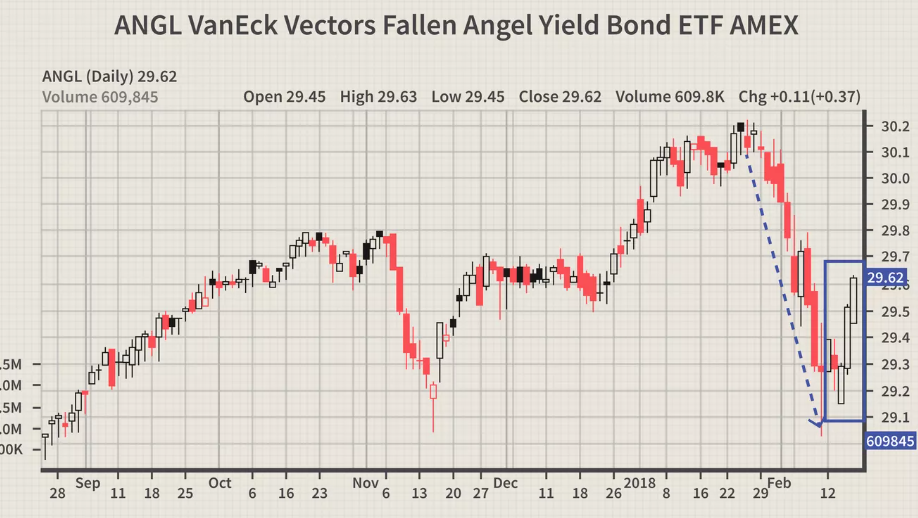
Example:
- Here’s a perfect example of a stock showing strong bullish candlestick patterns with tweezer bottoms. And you can see what happens next.
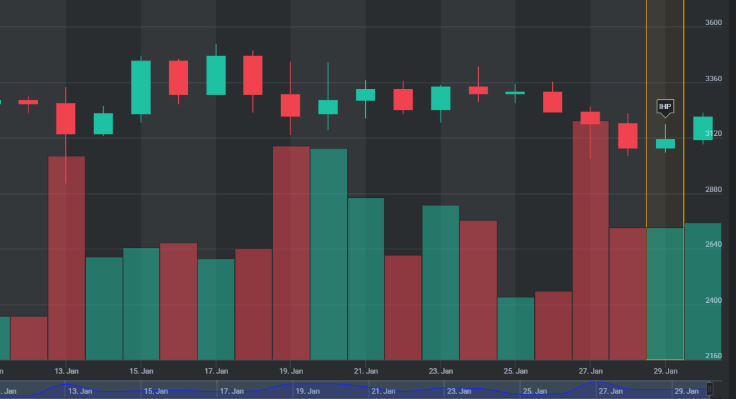
8. Doji at Support
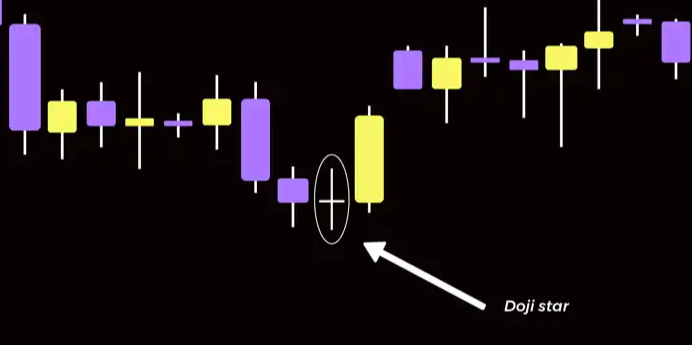
The Doji candlestick forms when an asset’s open and close prices are roughly the same, creating a tiny body. When a Doji appears at a strong support level, it often signals a bullish reversal.
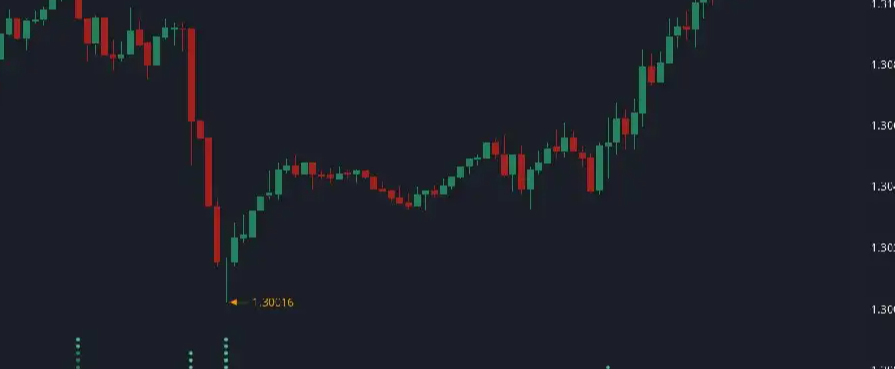
Example:
- Here’s the best example of a doji at support candlestick. This happened in the Forex market on the GBP/USD pair some time ago. As shown in the chart below, seeing a perfect pattern of this type is quite rare.
Bullish vs Bearish Candlestick Patterns
Ok. Bullish vs bearish candlestick patterns. What’s the difference? Excellent question.
While bullish crypto patterns help you spot upward trends, bearish candlesticks do the opposite. They indicate selling pressure and the likelihood of a price decrease.
Putting it slightly differently, bullish patterns in crypto indicate a potential uptrend in the market, while bearish patterns suggest a possible downtrend.
Strong bullish candlestick patterns, like the ones we discussed in this post, typically (but not always) signal an oversold market and a potential buying opportunity.
Conversely, bearish patterns such as the Shooting Star, Evening Star, and Dark Cloud Cover indicate an overbought market and could be a sign for traders to sell or short their positions.
No single candlestick pattern should be used alone to make trading decisions. It’s always best to use these patterns with other technical analysis tools for confirmation.
So why are candlestick patterns so popular among traders?
One reason is the visual representation they provide of market sentiment. For many traders, looking at a chart is an easy way to see shifts in the market, mainly to determine whether buyers or sellers are in control.
Another reason is their versatility. Candlestick patterns can be used on any timeframe and for any financial instrument, making them a valuable tool for all types of traders.
Have you ever seen a trading graph with confusing squiggly lines on it? Those are called “indicators”. Crypto candle patterns can be combined with other forms of analysis, such as support and resistance levels, trendlines, and indicators, to create a comprehensive trading strategy.
Understanding the differences between these patterns enables you to identify when to buy and when to exercise caution.
Understanding Continuation and Reversal Patterns
Continuation patterns are like the universe telling you, “Hey, this trend isn’t going anywhere… yet.” When you spot one of these, the market is merely taking a breather, perhaps grabbing a coffee, before continuing in the same direction.
Think of it as a pit stop — not a detour.
On the flip side, reversal patterns announce, “Guess what? Time for a plot twist!”
These patterns signal that the market is shifting gears and heading in the opposite direction. Spotting these can be your ticket to staying ahead of big moves, whether the trend’s doubling down or flipping the script.
Not all bullish patterns lead to price reversals. Some indicate continuation of a trend:
- Reversal Patterns signal a shift in direction (e.g., Bullish Engulfing).
- Continuation Patterns suggest sustained momentum (e.g., Three White Soldiers).
Knowing which pattern you’re dealing with helps you plan your trades better.
How to Make Profits Using Bullish Patterns in Crypto
Alright, so you’re probably wondering how to put these bullish patterns to work and grow your crypto portfolio. First things first — patience is key.
Spotting a reliable bullish pattern isn’t about jumping at every green candlestick you see. It’s about waiting for confirmation.
For example, if you’re tracking a double bottom, you want to see the price break above the neckline before investing your hard-earned money. Pair it with some volume analysis — a solid volume spike as the price breaks out could be a good sign.
Don’t forget to set those stop-losses. Sure, we all dream of hitting the moon, but sometimes the market will give you a trip back to Earth instead.
Protecting your capital should always be a priority. Compounding small wins by hitting those bullish moves consistently is way cooler than risking it all on one wild gamble. Here are some other things to think about:
Things You Should Consider
- Volume Confirmation: A pattern backed by high trading volume is more trustworthy.
- Support and Resistance Levels: Bullish crypto patterns should align with key price zones for accurate predictions.
- Market Trends: Avoid using bullish patterns during choppy or unclear trends.
Things You Should Try to Avoid
- Over-relying on Patterns: Use them alongside other technical indicators.
- Ignoring Market Sentiment: Regulatory announcements can significantly impact crypto prices. That’s why it’s crucial to monitor key indicators such as CPI reports, Fed meetings, and major international macroeconomic events.
Want to Learn More About Candlestick Patterns in Crypto Trading?
Bullish candlestick patterns are awesome. We love them. But to take your trading game to the next level — check out Dypto Crypto’s free courses.
You’ll learn about the best bullish candlestick patterns. And so much more. We discuss trading strategies tailored to new and inexperienced crypto users in plain language, so you can get started without being confused or overwhelmed by too much jargon and squiggly lines that don’t make sense. Don’t worry. With our help, they will.
FAQs
Which candlestick pattern is most bullish?
The most bullish candlestick pattern depends on the context, but a popular contender is the Morning Star. The market says, “Good morning, I’m ready to go up now!”
You’ll usually see it after a downtrend, a three-candle pattern. First, there’s a big red (or bearish) candle. Then, a small, indecisive one — think of it as the market scratching its head.
Finally, there’s a big green (bullish) candle showing that buyers are taking charge. It’s a solid signal that momentum might be shifting upward.
What is the 5-candle rule?
The 5-candle rule is a sanity check for decision-making. Instead of just impulsively trading based on one shiny candlestick, it gives you a broader view.
You look at five candles to confirm a trend or pattern to avoid acting on a fluke. It provides context and increases your chances of being right (or at least less wrong).
How to identify bullish patterns?
Spotting bullish patterns in crypto takes a bit of practice, but you’re mostly hunting for signs that buyers are starting to flex.
Patterns like the Hammer, Morning Star, or Bullish Engulfing candle are great examples.
Look for smaller wicks on the bottom and stronger, fuller candles moving upward—those are clues that buyers are upping their game.
Can bullish patterns be used for short-term trades?
They can! Bullish patterns can be your best buddy if you’re into short-term trading.
They help you identify potential price reversals or upward momentum in the short-term charts, like the 15-minute or 1-hour ones. However, be aware — you’ll want to act quickly and keep a close eye on volume (and, of course, have an exit plan). Don’t fall asleep at the wheel with short-term trades.
How accurate are bullish candlestick patterns in predicting price moves?
Well, they’re not crystal balls (unfortunately), but they’re pretty decent. Think of them like a weather forecast — it’s useful, but not always 100% right.
Bullish candlestick patterns give clues about what might happen next based on past price movements and current trader behavior. Accuracy improves with volume confirmation and overall market context.
Do bullish patterns work on all crypto timeframes?
They sure can, but the key is to match the pattern to your trading style. Short timeframes like 5-minute or 1-hour charts for day traders can show bullish patterns that may lead to quick moves.
Daily or weekly charts for swing traders provide patterns that reflect longer-term trends.
The rules are the same, but the results depend on the time horizon you’re working with.
About the Author