“Bearish” is the word no trader ever wants to hear.
It’s a harbinger of doom: a bearish sentiment means people see bad times ahead for the markets and think asset prices are likely to fall.
However, bearish patterns are as scary for crypto traders as they are important to understand and recognize. If you can predict downward trends in advance, you’ll be able to make smarter investment choices and avoid, or at least mitigate, major losses.
This is where candlestick patterns come in. They serve as signals of downward trends, allowing you to predict bear markets and act accordingly.
What is a Candlestick Chart?
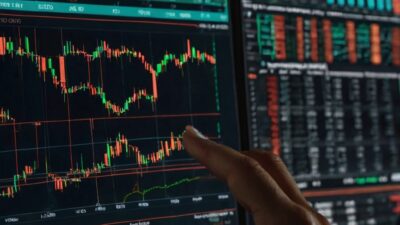
Candlestick charts are a common way to visualize price movements for commodities, securities, and cryptocurrency assets.
They feature a thick body, which represents the open and close prices of the asset in question, with thin lines above and below to represent the respective highs and lows throughout the trading session.
When viewed over time, these candlestick charts can reveal important information about the price trends of a specific asset and provide clues about what is likely to happen in the future.
What is a Bearish Candlestick Pattern?
A bearish candlestick pattern refers to a specific shape that is often observed on charts.
They appear after uptrends and suggest that a downtrend is about to happen. This indicates that selling pressure has overtaken buying pressure after a run-up, suggesting that the bull market is coming to an end and a bear market is on the horizon.
There are numerous bearish candlestick patterns to look out for, each of which conveys a slightly different message. In this article, we’ll go through some of the most common patterns, how to spot them, and what they mean.
8 Bearish Candlestick Patterns Every Crypto Trader Should Watch Out For
Bearish candlestick patterns come in various shapes and sizes, and there are dozens of potential ones to consider. They are based on several factors and depend heavily on context.
It’s essential to remember that candlestick patterns are merely indicators. Even strong patterns don’t offer a 100% guarantee of anything, and it’s important to take extra factors and data points into account when making any decision.
In the next section, we’ll take a look at 8 of the most common and useful bearish candlestick patterns that crypto traders should look out for and what they mean.
1. Bearish Engulfing
A Bearish Engulfing might sound like every hiker’s worst nightmare, but it isn’t a great situation for crypto traders, either.
It happens when a bullish candle is followed by a larger bearish candle that “engulfs” it. It means a small uptick in the market was closely followed by a larger downturn, and signals that a bear market may be ahead.
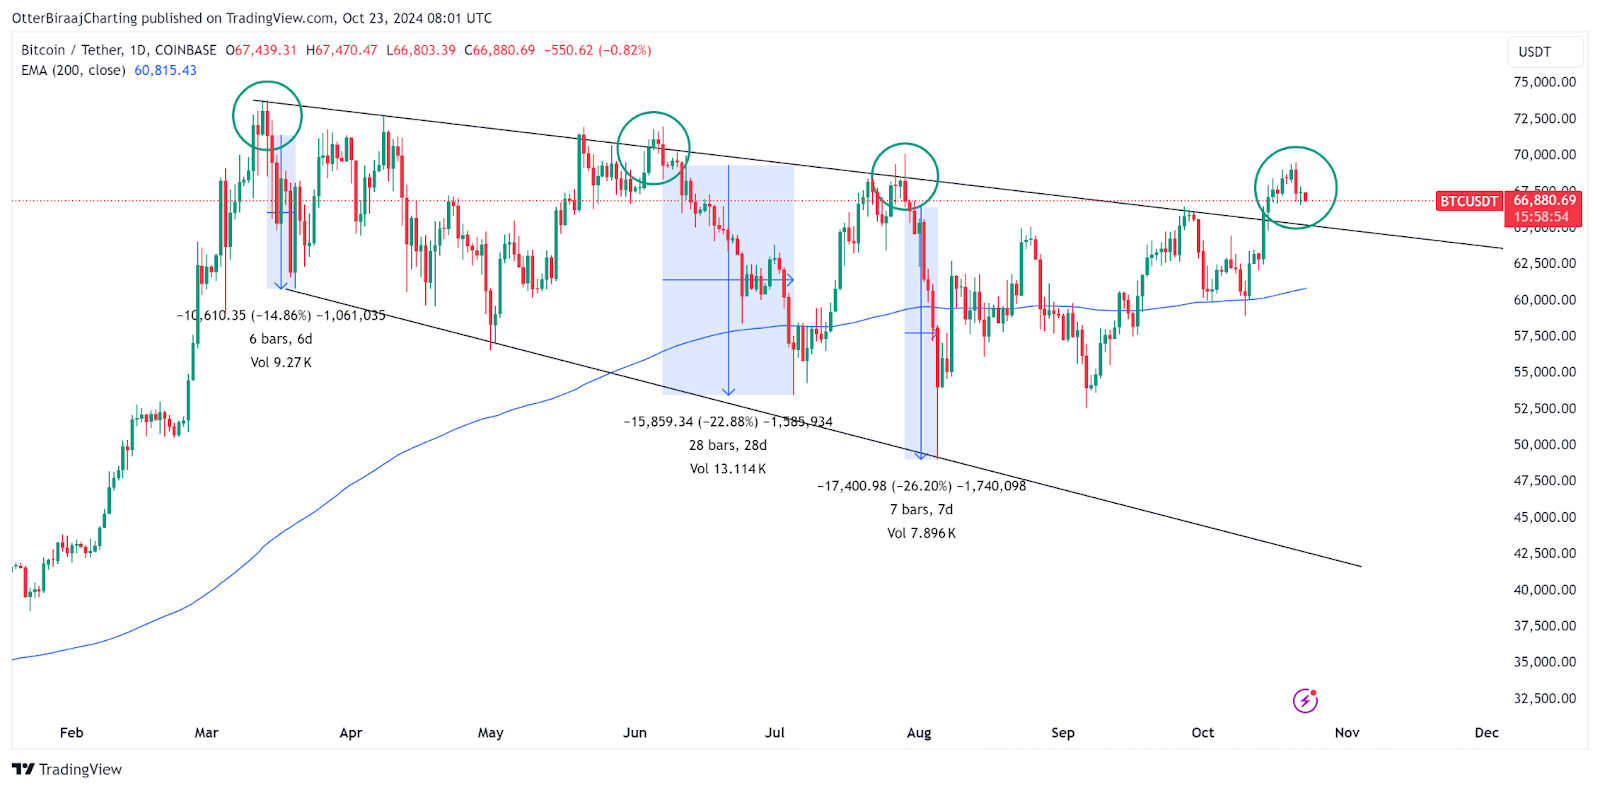
Several examples of bearish engulfing patterns appeared on Bitcoin’s daily chart in 2024, most notably on July 24 when a 26% drop followed the pattern in prices.
2. Dark Cloud Cover
A Dark Cloud Cover pattern is when a red (bearish) candle opens above a green candle’s close but then closes below its midpoint.
In practical terms, this means that bullish sentiment declined on the same day, casting a “dark cloud” over the day’s previously good performance.
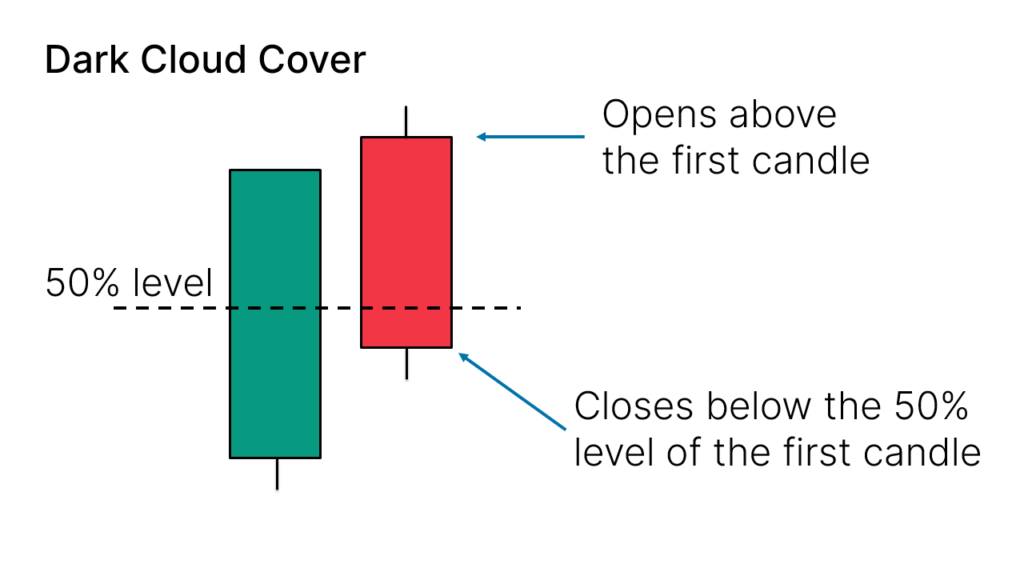
This pattern is especially significant when it forms at resistance, when an asset has been struggling to move higher. When a dark cloud forms at a time like this, it’s a suggestion that people are beginning to sell the asset.
3. Evening Star
An Evening Star candle pattern features three candles: a strong green candle, followed by a small indecision candle, and finally a strong red candle, indicating the beginning of a downward trend.
You can also refer to this pattern as a “bearish reversal pattern”, as it shows that a previously optimistic sentiment has been flipped around. The second day, represented by an indecision candle, marks the point at which the bulls become exhausted before the bears begin to step in.
When does this happen in crypto? One example is at market peaks. For instance, in March 2024, after a long bull run for Bitcoin, NewsBTC’s head of research spotted an Evening Star pattern, which was followed by several months of market volatility.
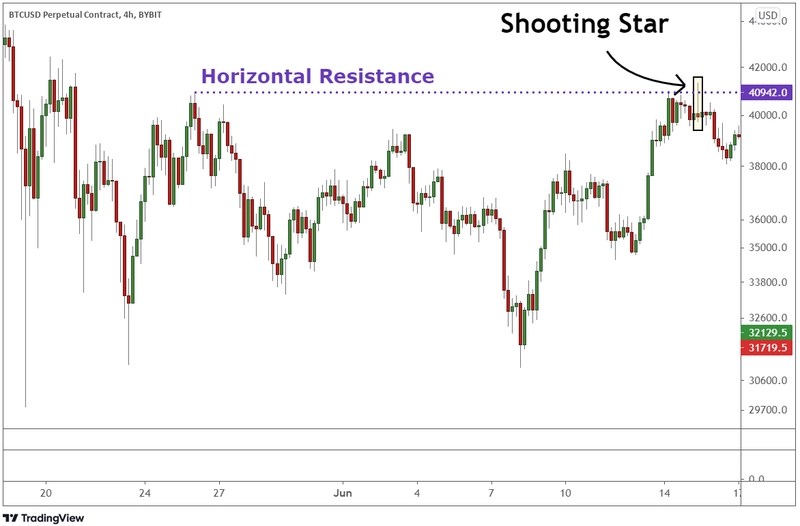
4. Shooting Star
Unfortunately, this Shooting Star is not named for its ability to bring good luck. It refers to a candlestick pattern with a small lower body and a long upper wick at the end of an uptrend.
It’s formed of a single candle and shows that the price opened, sharply increased, and was then hammered down to close near the open.. Like a star falling from the sky (see, these names make sense!
The Shooting Star pattern happens when bulls drive up a price, but bears quickly take over. In crypto, this pattern is typically a sign that bulls tried and failed to drive the price of an asset higher. You’ll want to look for confirmation the next day, in the form of a drop or bearish volume spikes.
5. Hanging Man
It’s hard to think of a more disheartening symbol than the Hanging Man. This candle pattern appears at the end of an uptrend, with a small body at the top of the range and a long lower shadow.
In other contexts, this pattern is referred to as a hammer and is a signal of good news. However, when it appears at the top of an uptrend, it’s a bad sign, indicating that sellers drove prices down during a session before bulls were able to bring them back up.
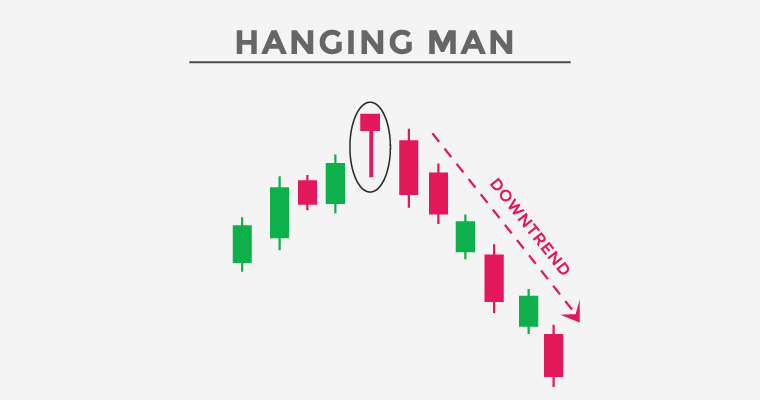
An example in crypto is ETH/USD spiking up and then drifting up slightly. It’s not necessarily a sign of certain doom, but it can be a warning sign that resistance is beginning to form.
6. Bearish Harami
The Bearish Harami pattern is a two-bar reversal that features a large green candle followed by a red candle within its body. It’s named because the word harami means “pregnant” in Japanese.
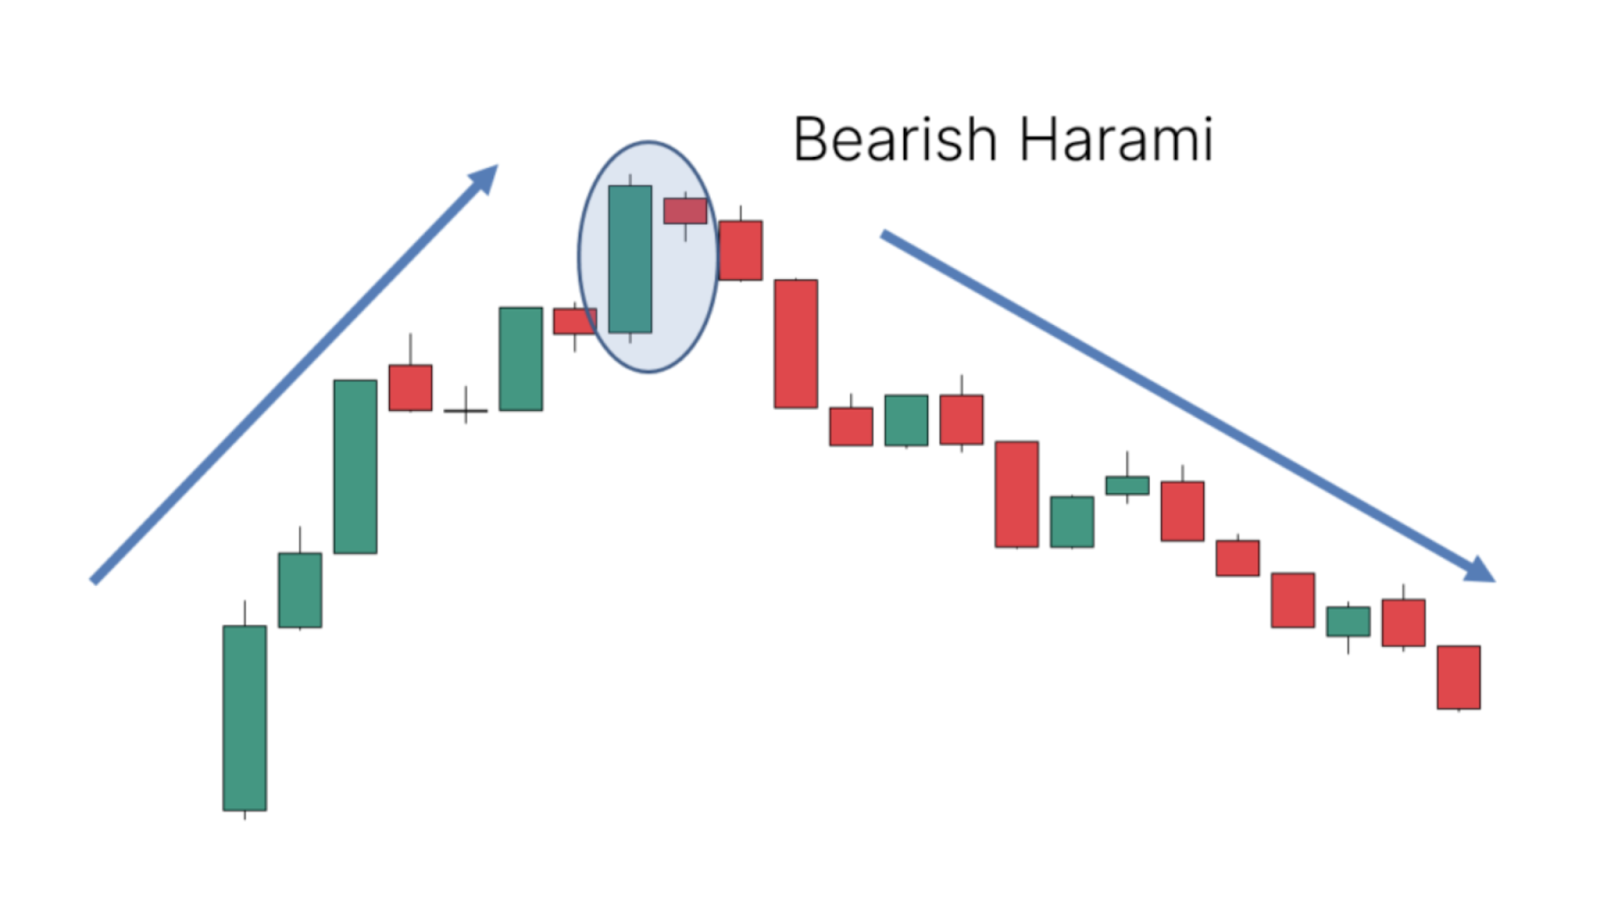
This candle indicates that an uptrend has stalled, and selling pressure may soon overtake buying pressure. It’s a warning flag: in mid-2024, some altcoins showed bearish Haramis as they hit resistance levels.
On its own, the Bearish Harami is just a sign of indecision. You need to look for further confirmation in the form of more bearish candles or volume spikes.
7. Three Black Crows
The Three Black Crows pattern consists of three consecutive red candles, each opening within the body of the previous candle and closing lower.

This is one of the most decisive markers of a bearish trend. It means the bears have overtaken the bulls over three sessions, and traders will generally interpret this pattern as a sign of a sharp correction.
8. Doji at Resistance
A Doji candle is a single candle where the open and close are equal, forming a + shape. This is usually a sign of uncertainty, but when it appears at a point of resistance, it can signal a potential downtrend, as it indicates that buyers have been unable to push the price higher.
This pattern may indicate that a bearish reversal is imminent. In mid-2024, we observed several Doji candles as Bitcoin repeatedly stalled around $ 65,000–$ 66,000. And each time, those dojis (especially on higher timeframes) were followed by a pullback.
The Difference Between Bullish and Bearish Candlesticks
Candlestick patterns aren’t always harbingers of doom. They can also signal good times ahead, and the market shifting to a more optimistic outlook after a bearish trend.
Bullish candlesticks, in contrast to their bearish counterparts, appear at the end of downward trends and indicate that prices might be on the verge of increasing. These candlesticks are typically green in color and usually close above the open price.
Tips for Making Use of Bearish Candlestick Patterns in Crypto Trading Strategy
Now that we know what bearish candlestick patterns are, what they look like, and what they signify, it’s time to take a look at some tips for making the most out of these indicators.
Always Confirm With Volume and Trend Direction
In isolation, candlestick patterns often don’t tell us much. These signals are more meaningful when they occur on a volume that is larger than average and follow a clear uptrend.
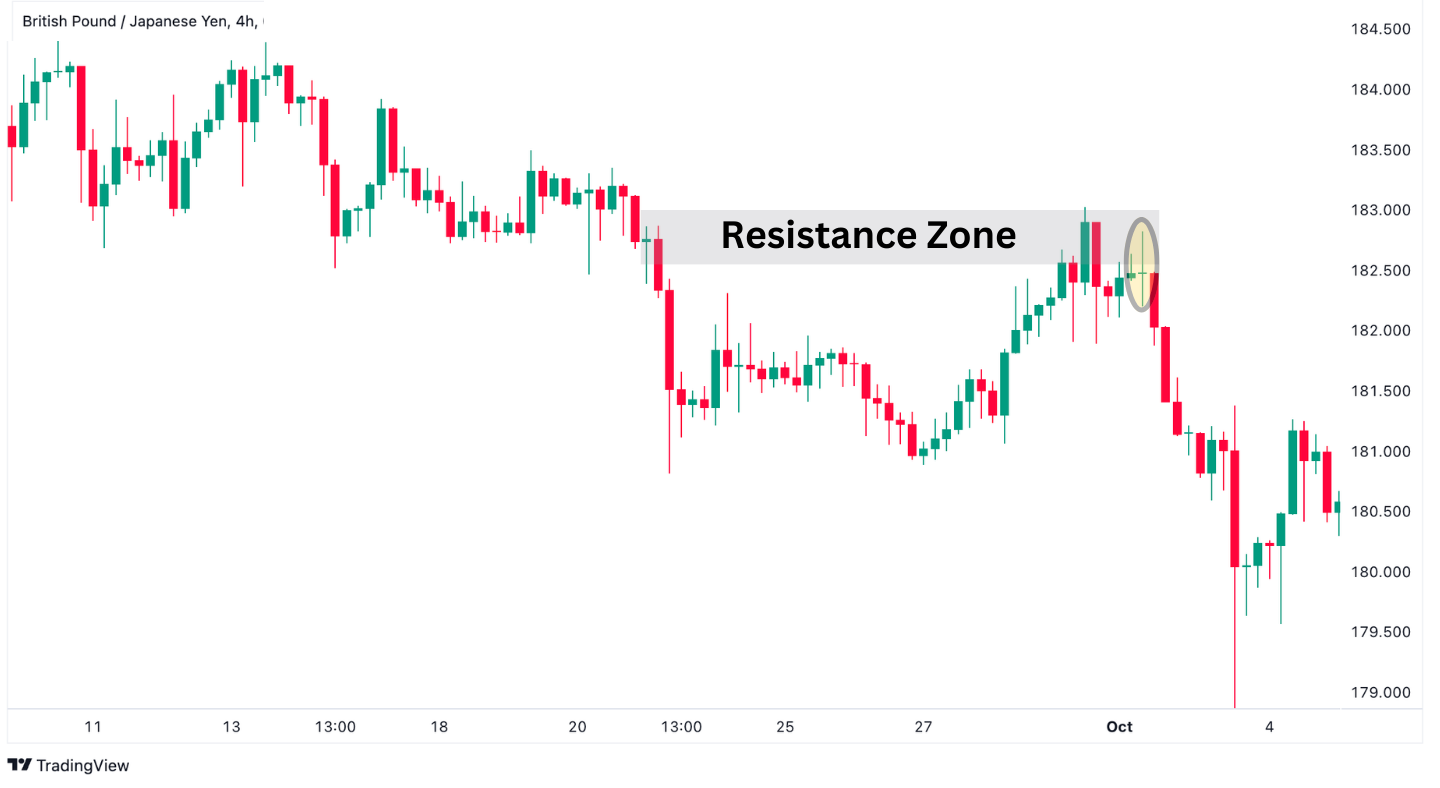
Resistance Zones Make Bearish Candles More Powerful
Bearish candles tend to be more useful in resistance zones, where an asset has been struggling to increase in price for an extended period. Here, a bearish candlestick pattern indicates that resistance to a downtrend is starting to falter.
Use Multi-Timeframe Analysis for Better Accuracy
A candlestick pattern in a 4-hour timeframe doesn’t tell us a whole lot, especially if the daily chart is rocketing up. To gain a clearer picture, you need to zoom out and examine different timeframes. Many professional traders will only pay attention to candle patterns if they appear on both their entry timeframe and a higher one.
Be Extra Careful of False Signals in Ranging or Choppy Markets
A lack of reliability isn’t the only risk with candlestick patterns; they can also sometimes be downright misleading. In a choppy market — one that lacks a clear trend in any direction — bearish candle patterns might stall the price momentarily, but not for any meaningful length of time. Be careful not to make any decisions based on these false alarms, and confirm the trend with additional data, like further candles, before taking action.
Don’t Rely Solely on Candlestick Patterns
Candlestick patterns can be useful data points, but they shouldn’t be the only basis for any trading decision. You should always look for other indicators, like a divergence from the relative strength index (RSI) or a spike in trading volume, to confirm any trend.
Backtesting the Candlestick Patterns Can Help
One helpful way to verify a candle pattern is to compare it with past data. What happened the last time this pattern appeared in the charts for your given asset? What kinds of trends followed? And what were the conditions like in terms of volatility, market regime, and so on?
Want to Learn More About Candlestick Patterns in Crypto Trading?
Candlestick patterns are among the many tools crypto traders utilize to make informed decisions, minimize losses, and build a secure and sustainable portfolio.
This is just one example of how the right knowledge can give you a major advantage and help you avoid pitfalls that less informed traders might walk right into. The more you know about trading, the better your prospects over time.
That’s where Dypto Crypto can help. We offer free courses and guides on crypto trading and investment, covering everything beginner traders need to know to get started safely and confidently.
Frequently Asked Questions (FAQs)
Q: What are bearish candlestick patterns?
Bearish candlestick patterns are patterns that appear on trading graphs and signal the end of a bullish trend (where prices are rising) and the beginning of a downtrend.
Q: Is a bearish candle a buy or sell?
A bearish candle indicates that more people are selling the asset in question, suggesting that prices are likely to start falling.
Q: What is the 3-candle rule in trading?
The 3-candle rule refers to a pattern where the same type of candlestick appears on a chart for three consecutive days. This kind of pattern is a strong indicator of a negative or positive trend.
Q: What is the difference between a bullish and bearish candlestick pattern?
A bullish candlestick pattern typically forms at the end of a downtrend and can signal that prices are likely to rise soon. A bearish candlestick pattern usually appears at the end of an uptrend and might indicate that prices are about to start falling.
Q: How many candlestick patterns are there?
There are many different candlestick patterns out there, including the Bearish Engulfing Pattern, the Dark Cloud Cover pattern, and the Evening Star pattern.
About the Author