


Crypto moves incredibly fast, and in 2025 alone, Bitcoin recorded dozens of 24-hour sessions in which price swings exceeded 10%, a level of volatility almost unheard of in traditional markets. This speed and unpredictability make crypto trading fraught; a single wrong move could erase gains, and a single right move can pay off big.
That’s why many seasoned traders turn to moving average crossover trading strategies. By tracking the intersection of fast and slow-moving averages, MACs offer a rule-based way to spot changes in trend direction, helping traders detect when upward momentum is building or when bearish pressure may be gaining strength.
What Is a Moving Average Crossover?
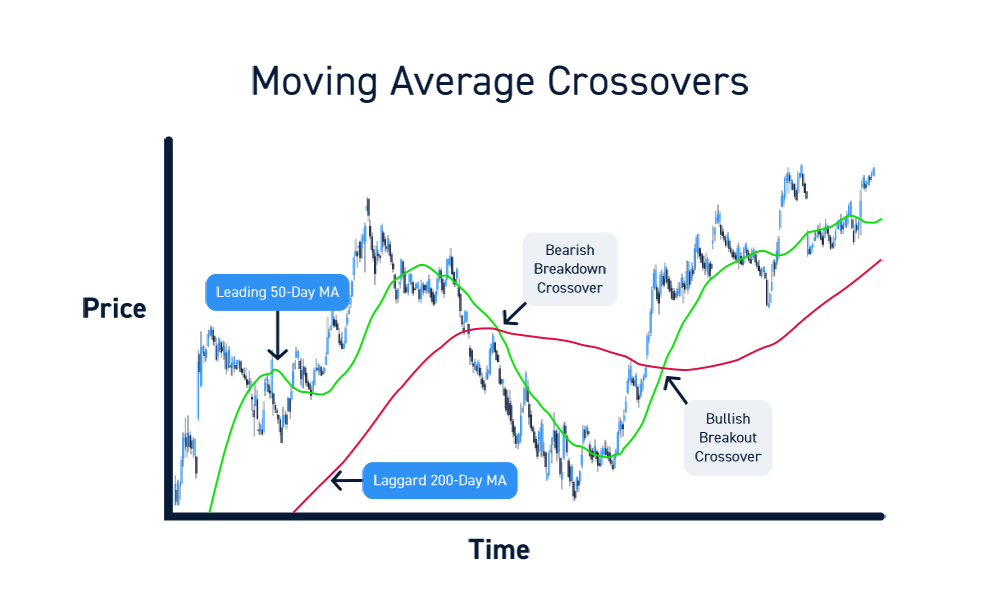
A moving average crossover takes place when two moving averages, one calculated over a shorter period and the other over a longer period, intersect on a price chart. The short-term MA reacts more quickly to recent price changes, while the long-term MA smooths out price data over a larger history.
When the short-term MA crosses above the long-term MA, it is interpreted as a bullish signal (a potential buy), indicating that recent price momentum is strengthening. When the short-term MA crosses below the long-term MA, it can signal weakening momentum or the start of a downtrend, as short-term prices lose strength relative to the longer-term average.
Example
Suppose you track a 20-day short-term MA and a 50-day long-term MA for a cryptocurrency. Over the past 20 days, the average closing price has risen steadily, so the 20-day MA has increased from $48 to $52, whereas the slower 50-day MA lags at $50. Once the 20-day line crosses above the 50-day line, the crossover is considered a “buy signal,” implying that recent price strength may carry into a broader uptrend. If, later, the 20-day drop under the 50-day, traders should consider it a “sell signal,” implying a possible downtrend.
Why Use Moving Average Crossover in Your Trading Strategy
MA crossover strategies are popular among traders, including crypto traders, as they offer a clear, rule-based way to identify trend direction and potential entry and exit points. By smoothing out price fluctuations, the MA filter reduces noise inherent in volatile markets, making it easier to see when short-term moves may be turning into a stronger, longer-term move.
Moreover, the crossover strategies provide objective signals. When a short-term MA crosses above a longer-term MA, it suggests increasing bullish momentum; when it crosses below, it can imply bearish sentiment. This reduces reliance on emotions or guesses, especially in a space where sentiment shifts quickly. Lastly, moving average crossovers are adaptable. Traders can tailor the MA time frames and periods to their investment style.
Popular Moving Average Crossover Strategies Used in Crypto Trading
Choosing the right moving average (MA) crossover strategy depends on how fast you want to react and how much confirmation you require. Short-term MAs respond quickly to price fluctuations, giving you agility. Longer-term MAs move more slowly, providing smoother trends and more reliable confirmations but fewer entry opportunities. Matching the MA combination with your timeframe can align the strategy with your goal and risk tolerance.
Golden Cross and Death Cross Strategy
The Golden Cross forms when the 50-day MA crosses above the 200-day MA, showing a shift toward long-term bullish momentum. On BTC and ETH daily charts, these crossovers have historically appeared near the early stages of extended uptrends, often after the price has recovered from a long decline.
The Death Cross, on the other hand, forms when the 50-day MA drops below the 200-day MA. This pattern appears during weakening market conditions and can act as an early warning that a broader downtrend may be developing.
As both MAs use long-term data, these signals appear infrequently but carry stronger trend implications.
20/50 MA Swing Trading Strategy
A medium-term strategy that uses a 20-period short MA and a 50-period long MA captures moves that last several days to a few weeks. Compared to the 50/200 setup, this one reacts faster, gives early signals, and is more stable and smoother than very short-term MA crossovers. This balance makes it a good fit for swing trading altcoins or mid-cap tokens.
On 4-hour or daily charts, 20/50 crossovers can help you join trends early while avoiding many of the false signals common in more aggressive, short-term setups.
9/21 EMA Day Trading Strategy
Traders interested in short-term moves, such as day trading or quick trades, should use a fast EMA crossover. Using a 9-period EMA (fast) and a 21-period EMA (slow) on 1H or 4H charts helps quickly identify recent momentum shifts. Because EMAs give more weight to recent prices, they react faster compared to simple MAs, enabling quicker entries and exits.
This setup is useful for capturing short bursts of upward or downward momentum. In the trending conditions, a 9/21 EMA crossover lets you ride a quick move in or out. However, because of faster responsiveness, it’s also more vulnerable to “whipsaws” (fake signals generated by noise or sudden volatility spikes). So make sure it’s used with a clear trend context or additional confirmation.
5-8-13 Fibonacci Ribbon (EMA)
A “ribbon” strategy layers several EMAs (e.g., 5, 8, 13) together to create a band of moving averages rather than just a pair. It helps visualize not just a single crossover but broader trend strength and momentum over short to medium periods. When the ribbon tightens, spreads out, or changes direction, it can signal a potential trend reversal, pullback, or accelerating move.
This approach helps scalpers and algorithmic bots gauge trend strength, avoid noisy reversals, and select entries/exits with greater conviction. The multiple EMA lines provide more context than a simple crossover, showing whether recent momentum is weakening, building, or reversing, which is useful when the market swings sharply or unpredictably.
Pros and Cons of MA Crossovers
MA crossovers make trend detection simple. Instead of reacting to every sentiment, traders get clear buy/sell signals when a short-term MA crosses a long-term one. This helps reduce emotional trading, keeps decisions rule-based, and works across many timeframes. This provides an easy way for beginners to spot trend shifts without requiring advanced technical tools.
However, note that this strategy isn’t perfect because it relies on historical price data, and the signals often arrive late. They can also generate false signals in sideways or choppy conditions, causing traders to enter and exit too often. In highly volatile conditions, noise can cause rapid whipsaws, and during consolidation periods, the MA system may underperform relative to other strategies.
| Pros | Cons |
| Easy to understand and implement, even for beginners. | Signals lag and often come in after a move has started. |
| Help smooth out noise and clarify trend direction. | It can produce false signals in sideways or choppy markets. |
| Work across different timeframes from day trading to long-term investing. | Do not account for volume, volatility, or broader market context. |
| Provide clear, rule-based entry/exit signals to reduce emotional bias. | Frequent usage in volatile markets may lead to overtrading or poor timing. |
Best Indicators to Combine With MA Crossovers
While MA crossovers are a solid way to detect trend changes, relying on them alone can yield false or weak signals. That’s why many traders combine MA crossovers with additional confirmation tools to improve reliability. These additional indicators help verify that a crossover reflects a real, sustainable price move rather than a momentary blip or noise.
By layering MAs with momentum, volume, or timeframe-based filters, a strategy becomes more robust. So instead of taking every crossover as a trade, you only act when multiple conditions align to increase the probability of success and reduce emotional trading.
Using RSI and MACD for Stronger Trend Confirmation
The Relative Strength Index (RSI) and Moving Average Convergence Divergence (MACD) are the common “helpers” to pair with the MA crossover.
The RSI helps gauge whether the market is overbought or oversold. When paired with a crossover signal, RSI indicates whether the trend still has room to move or is close to reversing. To understand this further, a bullish crossover supported by a rising RSI from oversold levels is more convincing than one that forms when the RSI is already overbought.
MACD helps reveal momentum by comparing two moving averages and plotting a signal line. If the MACD line crosses above the signal line around the same time your MA crossover appears, it strengthens the case that a new trend is forming. When both RSI and MACD cross over, traders receive clearer confirmation that an entry may be valid.
Volume & ATR
Volume is a powerful confirmation tool that shows whether traders are actually supporting a breakout or trend shift. A crossover that occurs at low volume may not hold, whereas a crossover with rising volume indicates stronger conviction in the move. This helps traders avoid entries triggered by random price spikes.
Average True Range (ATR) adds another layer of insight by measuring volatility. High ATR periods can create false crossovers because price swings widen, while very low ATR may signal weak market conditions. Checking ATR before taking a crossover helps traders gauge whether the market is sufficiently stable to support a reliable trend or too volatile to trust the signal.
Multi-Timeframe Filtering
This includes checking signals across multiple timeframes, a simple yet effective filter. While a crossover on the 1H chart may look promising, if the daily trend is still bearish, the smaller-timeframe signal can easily fail. Confirming the overall direction on a higher timeframe helps ensure the user does not trade against the dominant trend.
Once the higher-timeframe trend supports the user’s crossover, they can lower the timeframe to fine-tune their entry. This keeps the user aligned with broader market movement, while still allowing precise timing, helping them avoid premature or counter-trend trades.
Risk Management While Using Moving Average Crossovers
Risk management is an important factor to consider when trading with moving average crossovers because these signals are based on historical price data and can lag during fast market moves. Crypto markets are volatile and can produce sudden spikes or sharp reversals that trigger false crossovers. To protect the capital, treat every crossover as a potential signal and use precise risk controls to avoid large losses when trends fail to follow through.
A practical approach is to place stop-losses just below recent swing lows when entering a long trade, or above recent swing highs when entering a short trade. This ensures your trade is invalidated only when the market genuinely breaks structure, not from normal fluctuations. Note that proper position sizing helps too, so risking a small percentage of your portfolio per trade keeps a single bad crossover from hurting your overall performance. Many trading education sources also stress the importance of avoiding overtrading, and crossover strategies tend to struggle in choppy markets, where prices whipsaw back and forth, and MAs cross repeatedly without direction.
However, no moving average crossover strategy is foolproof. Even widely used combinations like 50/200 or 20/50 can fail during unpredictable volatility. Consistent risk management ensures that losing trades remain controlled and winning trades have room to grow. Over time, this protects capital and provides strategic flexibility to perform as intended across varying market conditions.
How Crypto Market Structure Affects MA Crossovers
Because crypto trading never stops, price data never pauses. With no daily market close, moving averages update continuously so that trends can shift at any hour, including overnight or during low-liquidity periods. Compared to the traditional market with set trading sessions, this constant movement can create more short-lived spikes that trigger crossovers that don’t turn into real trends.
Volatility poses as another challenge in the space. Crypto assets experience fast swings that cause short-term moving averages to whip above or below long-term ones, leading to crossovers that reverse quickly. In sideways or unstable conditions, these signals become less reliable because the price isn’t following a clear directional trend.
Lastly, the decentralized nature of crypto can lead to inconsistent price behavior. While traditional asset show smoother, more regulated movement, crypto assets experience fragmented volume and weekend irregularities that distort price data. All these factors increase the chance of false crossovers, making it essential for traders to pair MA strategies with confirmation tools and strong risk management.
Testing and Optimizing Your Moving Average Crossover Strategy
Before risking real capital, it’s important to test any MA crossover setup in historical data. Use charting platforms, such as TradingView, that offer backtesting to simulate trades using historical price data. Running a backtest helps you measure the performance of a particular MA crossover by tracking key metrics such as returns, drawdown, win/loss ratio, and risk-to-reward.
After backtesting, tweak the parameter: change the length of short-term or long-term MAs, switch between simple (SMA) or exponential (EMA), or adjust the timeframe, by doing this across multiple scenarios, different assets, timeframes, or volatile regimes, to find MA settings that work reliably during different market periods.
Lastly, after identifying a promising configuration in backtests, the next step is forward testing or paper trading in real time (without real money). This helps confirm whether they can survive live market conditions, where slippage, volume or volatility. Continuously monitoring performance and frequently recalibrating settings help ensure the strategy remains robust as market behavior shifts.
Learn, Test, and Trade Smarter
Before using real funds with a moving average crossover strategy, run it through thorough backtesting on historical crypto data. Backtesting helps users see how a given MA crossover setup, such as 9/21 EMA or 20/50 SMA, would have performed under past market conditions. This process shows how many profitable trades it produced, how large drawdowns might have been, and how sensitive the results are to different MA periods or market regimes.
After backtesting is complete, refine and optimize your setup: adjust fast and slow MA lengths, test different MA types (SMA, EMA, ETMA, etc.), and tune entry and exit rules or risk controls. Some MA-optimization scripts automatically compare many MA-pair combinations and highlight those with the best historical profit and trade frequency, helping you find a statistically meaningful setup rather than depending on arbitrary values.
After optimization, test your refined strategy in a forward test under simulated real-time conditions or on a demo account before going live. This helps expose potential issues such as slippage, volatility spikes, or frequent false signals that backtesting might miss. This step can be considered a “dress rehearsal”: you are not risking capital yet, but you are verifying that your MA crossover logic holds up under realistic conditions.
FAQs (Frequently Asked Questions)
Are moving average crossovers reliable, and do they actually work?
It can be a reliable foundation for a trading strategy, but it is not foolproof. They work best in trending markets and tend to generate false signals in choppy conditions. Their effectiveness can be enhanced by integrating them with other technical indicators and risk management.
Which timeframe is best for crossovers?
There is no single “best” timeframe, so it’s recommended to choose one based on your trading horizon and risk tolerance.
- Longer-timeframe crossovers (e.g., 50/200 on daily) for long-term investing
- Mid-range (20/50) for swing trading
- Short MAs (9/21 EMA) or ribbon strategies for day trading
SMA or EMA for crossovers; which works better?
Both are important. SMA is smoother and less prone to false signals, making it more reliable in stable markets. An EMA reacts faster to recent price changes, which is useful for short-term or fast-moving trades, though it is more susceptible to noise.
How do I reduce false signals?
Combine crossovers with confirmation tools like volume, ATR, RSI, MACD, or multi-timeframe checks. Only act if the crossover aligns with other signs of trend strength or momentum.
Disclaimer
This article is for educational and information purposes, and should not be considered financial advice. For more information visit our disclaimer page
About the Author









